Publishers no longer count on generic analytics. They want to go beyond surface-level traffic such as “how many clicks” and dig deeper into who is clicking, what drives subscriptions, how many visitors are currently reading an article on their site, and the sources they are coming from. While granular data helps publishers gain micro-level insights into audience behaviour, real-time analytics help them track the site’s live performance and respond promptly.
The real-time analytics market size is estimated to grow to USD 5,258.7 million by 2032, with a CAGR of 25.1%. Though modern-day publishers understand and acknowledge the importance of granular and real-time data to stay relevant in today’s competitive landscape, they are yet to leverage these tools because of data security and privacy concerns of the users.
Keeping these publisher pain points in mind, Publytics has been devised to address this gap between accuracy and privacy. This specialized web analytics platform goes beyond generic data to help publishers gain a competitive edge. It helps publishers know their audience through granular, real-time analytics without putting their data privacy at stake.
What is Publytics?
While traditional analytics platforms help publishers monetize their content to a certain extent, they often fail to meet the requirements of content-rich portals or online publishers. Though these focus on general metrics such as page views and conversions, they do not usually provide deep insights on engagement rate, author performance, or scroll depth. Since these platforms sample data, they cannot give real-time insights that help publishers understand trends and take editorial decisions accordingly. Besides, tools that rely on third-party cookies can pose major privacy risks to users.
Built as an alternative to Google Analytics, Publytics aims to remove these challenges and redefine the way publishers track and analyze the performance of their respective sites.
Widely known for its publisher-first approach, Publytics provides both speed and depth through a combination of granular and real-time data. It also enables publishers to keep a track of user engagement, trends of audience response, and other crucial metrics, helping them make prompt editorial decisions backed by real-time and historical data.
It has an intuitive and sophisticated dashboard that enables publishers to track content performance across multiple sites and networks without sampling and make a long-term strategy to stay ahead of the curve. Most importantly, the privacy-focused platform is compliant with GDPR, CCPA, and PECR. This ensures accurate tracking without cookies, keeping users’ data privacy in safe hands.
Publytics is presently trusted by more than 1500 publishers such as Brocardi.it, Money.it, Comingsoon.it, and others.
In this detailed analysis, we will find out whether this customizable web analytics platform offers advanced features that publishers are looking for and whether it has the capacity to make the concept of data tracking smarter and efficient for them.
Features of Publytics
1. Real-time Dashboard
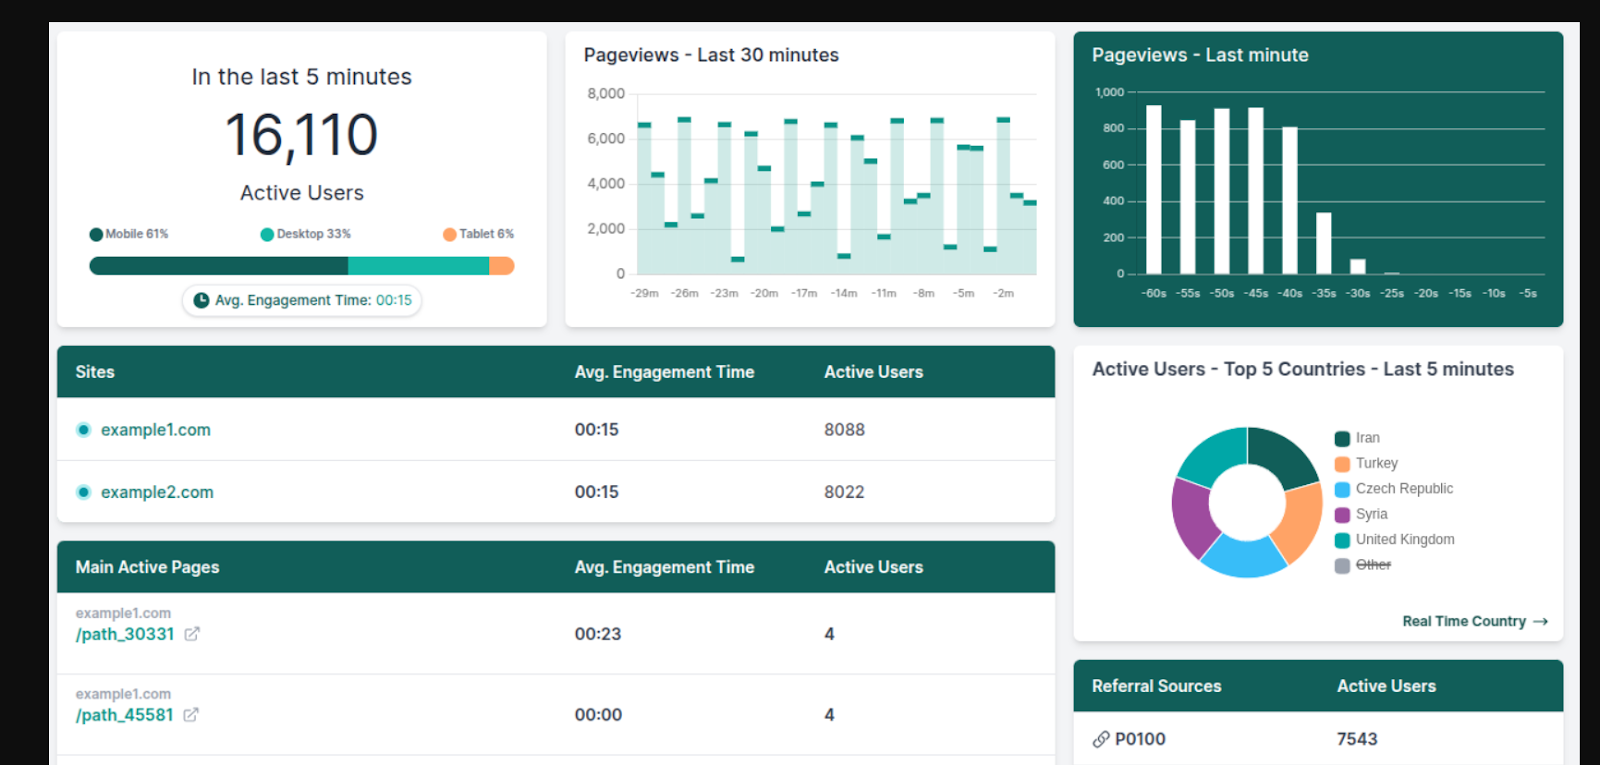
This is one of the most important features of Publytics that offers a competitive advantage to the publishers by allowing them to monitor the performance of websites on a real-time basis, with ‘real’ real-time having almost zero latency. Compared to traditional analytics, users do not have to wait for 24-48 hours for updates on today’s pageviews: these are immediate, thanks to “Real-time Trends”. Publishers can track user activity minute by minute, which includes the amount of time they are spending on a particular story, the sections that they are currently reading, their session behaviour, and even the sources they are coming from. Publishers can set their preferred time span (from 15 seconds to 30 minutes) and start tracking the metrics that seem relevant to them. These granular details can help them make immediate decisions such as adjusting headlines, improving sections, restructuring articles, or refining their editorial strategy.
2. ZeroSample Technology
When there is a generally high traffic or a sudden traffic spike, traditional analytics tools generally sample data to generate quick reports. But in the process, only a part of the data gets tracked and analyzed. Therefore, the results produced are not completely accurate.
With Zero Sample Technology, Publytics offers complete accuracy and takes the concept of data tracking a notch above. Without sampling, it has the capacity to analyze up to billions of page views in a month. It tracks every page visit, user clicks, or scrolls and does not leave out a single data point. All the results are based on facts and not guesswork. Even if it does not rely on sampling, thanks to an in-house technology, the results are still generated in a few seconds without any approximation. This is an important feature for publishers who have to constantly track a large amount of data to form an editorial strategy and cannot count on partial data.
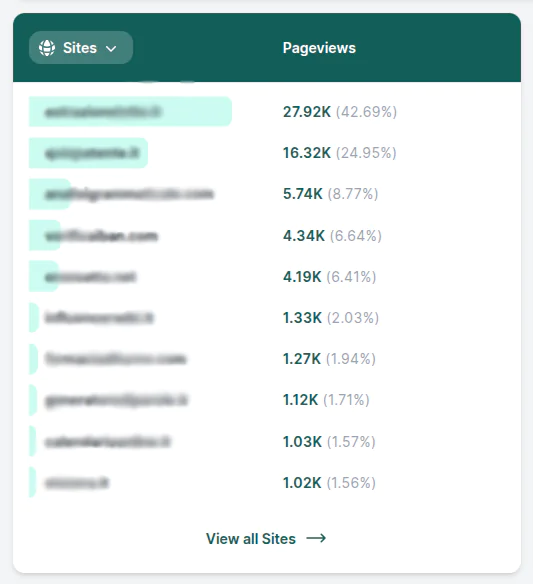
3. Multi-Site Dashboard
The complicated dashboards of traditional analytics platforms often make it difficult for publishers to track various multiple networks or sites at the same time. Publytics makes this easy for publishers through a multi-site dashboard. Instead of using different dashboards for each site and constantly juggling between them, they can use one dashboard to supervise the performance of all the sites, draw a comparison of the traffic trends, check audience behaviour, understand which site is attracting more leaders and driving conversions, and optimize the content accordingly.
If a publisher has multiple sites, this feature can be helpful. It not only solves the hassle of manual data handling, but also enables publishers to make a holistic decision based on the comprehensive data.
4. Customizable Dashboard
Pre-designed dashboards often show generic metrics that might seem restricted to the users and fail to give the insights that they are looking for. Keeping the unique requirements of publishers in mind, Publytics has shifted from this one-size-fits-all approach. This platform helps them create customizable reports with the metrics that seem relevant to them. Some publishers might want to create a report based on session depth or bounce rates while some publishers might want to focus on unique visitors or duration of a session. Accordingly, they can provide filters (date, location, category, or author), create personalized dashboards, get actionable insights in just a click, and take informed decisions that take them closer to their editorial goals.
5. Google Discover Tracker
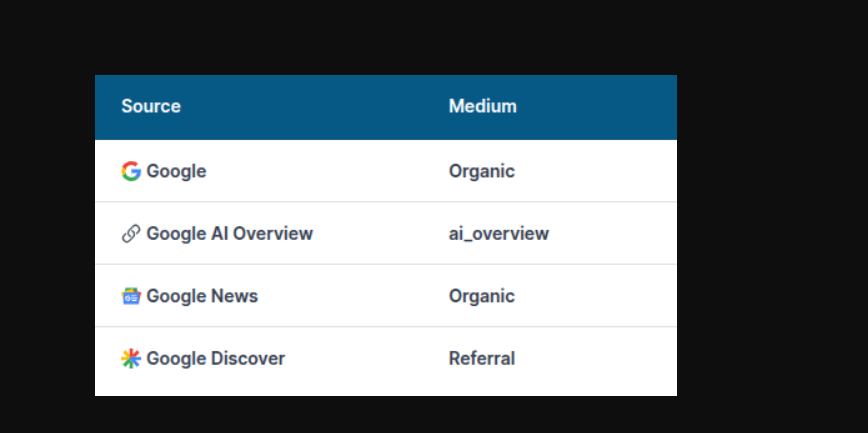
Publishers often fail to understand why certain articles trend on Google Discover. Publytics makes this easier for publishers. Through this tracker, publishers can uncover certain patterns and create a long-term strategy. Instead of counting on guesswork, they understand which topics are gaining attention from readers on Google Discover, identify the quality and frequency of traffic, and uncover the stories that are attracting impressions. These help them compare the performance of the sites over a period of time, upload similar categories of articles that are performing well, and create an effective content plan.
6. AI Traffic Tracker

With the advent of AI tools, the way content is accessed by the readers has also gone through a major paradigm shift. Not just Google, Publytics helps publishers track their traffic even on AI tools such as ChatGPT, Gemini, Claud, Perplexity, and others. They can identify which category of AI tools are visiting your website and which sections are being accessed the most. They can also closely track the change in interaction and discover whether the visibility of the site on AI tools is making an impact on their traffic
7. Historical Data Tracker
Just like real-time data, tracking historical data is also important to understand the growth of sites over time. Publytics allows publishers a seamless migration to the tool by letting them import historical data from analytics tools they have used in the past (such as Google Analytics 4) and analyze how the audience behaviour, engagement rates, and page views have changed with time. They can spot their areas of growth and assess sudden dips, keep a record of their long-term performance, and change their strategy accordingly. It makes sure no data is lost and helps users monitor the overall growth of the publication.
8. Event Tracker
Every reader is unique and has various ways of interacting with a site. For a publisher, it is important to go beyond page views and understand how users are engaging with the website. With the help of Publytics, you can check scroll depth, which indicates whether the visitor is finding the content interesting enough to read the entire article. You can also analyze, whether users are clicking on advertisements, whether they are subscribing or leaving the site on reaching a paywall, and form a 360-degree view of audience behaviour and conversion funnel.
9. UTM Tracker
This helps publishers understand and measure the impact of campaigns or social media posts with a combination of historical and real-time data. They can check which campaigns are engaging the users on which social media platforms, which posts are generating the maximum amount of leads, and even identify the kind of audience that are getting converted to subscribers. This can help them strengthen their audience targeting and optimize their marketing efforts.
10. API Access
For most of the analytical tools, the API access is limited. Publytics gives you the freedom to perform the same kind of query as the dashboard and manage core analytics data on a deeper level through programming. It is perfect for organizations that primarily want complete command over data. Through this tool, publishers extract historical and real-time data from Publytics in their own set-up and combine it with the data from other platforms for in-depth analysis. Without getting into the dashboard of Publytics separately, they can automate reports and get real-time insights. They can also create custom reports with relevant metrics for various team members which help them reach their unique goals.
Account Setup and Onboarding
1. Setting up your account
- Before making a paid account on Publytics, you can use their 14-day free trial option. This helps you explore all the features and understand how it adds value before making any commitment.
- At this stage, users do not have to provide payment details to sign up.
- During this period, users can take a closer look at the metrics and analyze the performance of their websites.
- You can use it while using Google Analytics simultaneously without worrying about the performance of your site, owing to the lightweight script.
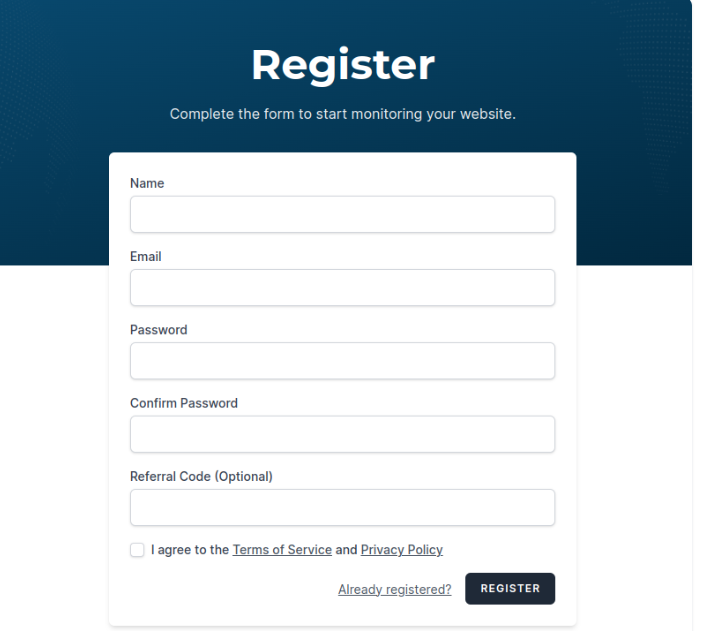
- On the top right corner of the homepage, you will find the Sign up button.
- You will be automatically redirected to the registration form once you click on it. Fill up the form with your name, email id, password, and the referral code.
- After you submit the form, you have to verify your email on your mail id.
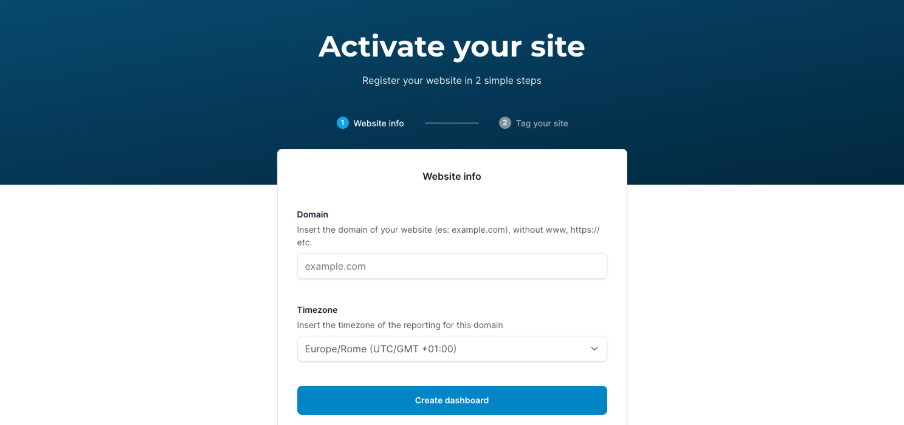
2. Registering your website
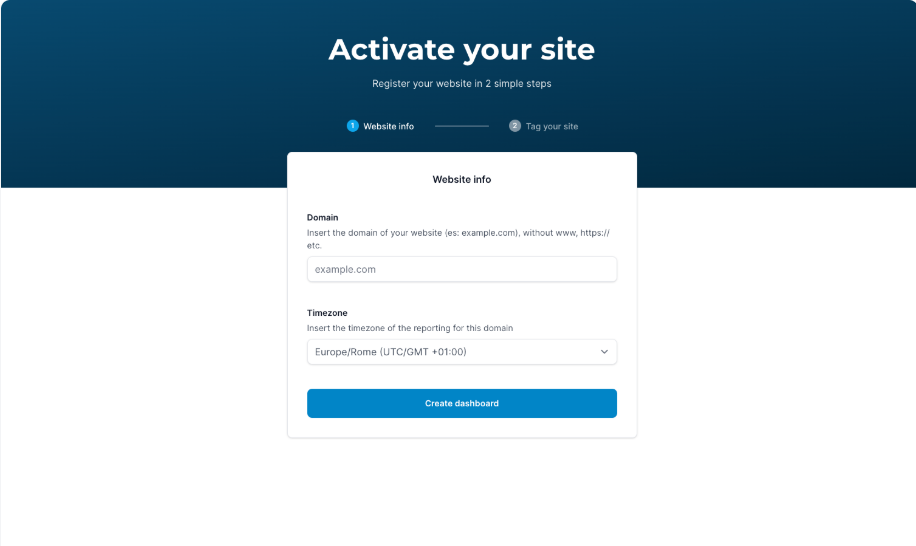
- After the verification process of your account is complete, the second step would be registering your website.
- In case you do not have a registered account already, you will be redirected to the ‘Insert site’ page.
- Make sure you provide the right timezone, because it cannot be changed after the process of registration is complete.
- Click on ‘Add Website’ if you already have a registered account.
3. Tagging
- At this stage, users will receive a lightweight JavaScript tracking script (<1KB).
- Simply copy and insert the script into the head tag of your website.
- Make sure you do not place it outside the headtag, or else it might not work and data will be lost in the process.
- Users can also customize the script based on their specific requirements.
4. Checking the platform’s functionality
- Go to Publytics > Realtime on the website.
- If the integration is working, your account is functional.
- Go to the home page and view Page Source.
- If your source code features the snippet of Publytics, then you can start using the dashboard right away.
- If you are still facing issues in accessing the dashboard, you can switch to incognito mode.
- If you don’t find the Publytics snippet code, it could be a cache issue.
- Clearing the cache memory will reflect the updated version of the site.
Customization Features
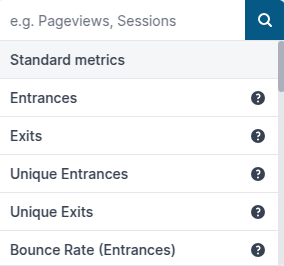
1. Custom dimensions
Unlike traditional analytics platforms, Publytics helps publishers go beyond standard metrics such as page views and dive deeper. They have the flexibility to add their own parameters such as category, topic, date, and author, and personalize the data according to their terms.
For example, by adding categories such as editorial, news or feature stories, they can segment the specific audience of each content group. They can check which category of content, such as travel content or technical content, or which author is attracting more users to the site and driving more conversions. It also helps them distinguish the engagement rate of evergreen content and trending content.
2. Custom Quality Metrics
It is important to know your audience inside and out to create an impactful content strategy. Pageviews don’t just determine your audience behaviour. To make sure you understand the pulse of your audience, it is essential to keep a tab on engagement metrics such as quality page views or scroll depth. The advanced plan of Publytics helps publishers customize these metrics and understand which type of content is resonating with the audience.
While quality pageviews help publishers analzye how much time is being spent by readers on a particular article, scroll depth focuses on whether the readers are reading the entire article or leaving the site in the middle of it.
For example, News or opinion pieces might have better scroll depth than sensational articles, whereas lifestyle stories might have better quality page views than an interview piece.
3. Custom Reports

Through this platform, users can design the data report according to their goals and cut out the noise. They can add the dimensions, filters, and metrics relevant to them and just focus on the critical metrics they need to make informed decisions.
Suppose they want to send a customized report on conversion rates based on content category to the marketing manager, or scroll depth reports to the editorial team, they can add the date range of a week or a month, the relevant filers, save the report and send it to the respective team members.
4. Custom Views
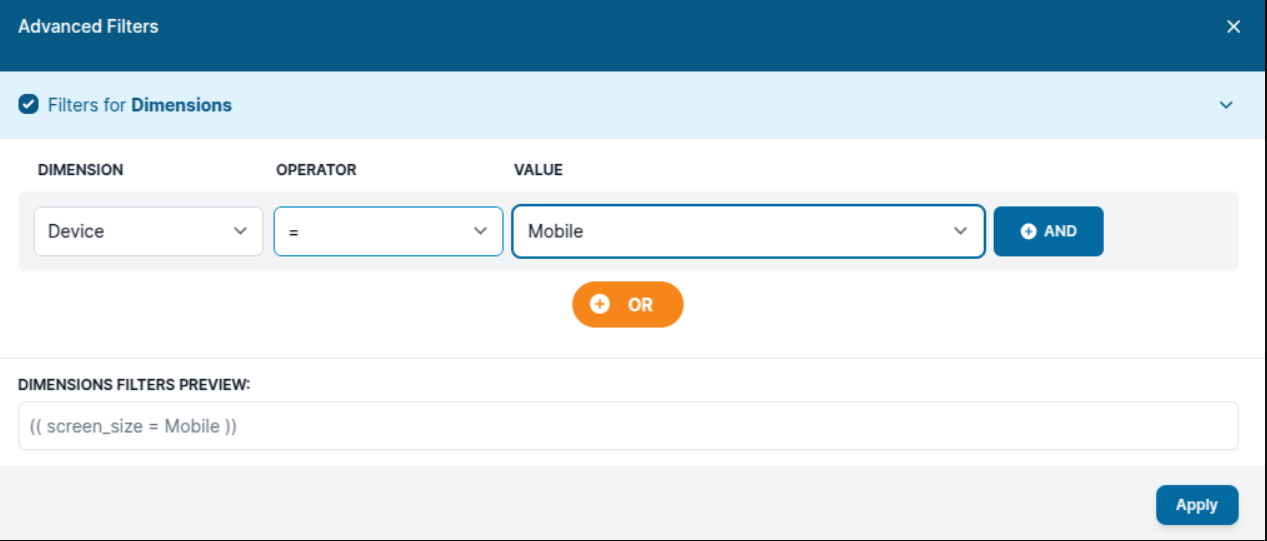
Through Publytics, a single dashboard can be easily converted into a personalized experience for various team members. Instead of going through irrelevant data, users can define traffic segments based on factors such as the location, content category, source, device from which the maximum traffic is being generated, and create special custom views for editors, stakeholders, marketing team, sales team, and other members of the organization. These help them conduct a detailed analysis based on the specific segments that matter to them. Users can enjoy complete or partial access of the dashboard without disrupting the view of the data for the users.
For example, publishers can perform a detailed analysis of the traffic from India and compare it with the traffic from France or other countries. On the other hand, marketing teams can prepare a report that revolves around the engagement rates of campaigns.
5. Custom Time duration
Beyond numbers that focus on content performance, publishers can do a detailed comparison of the website by adjusting the time frame. For example, they can compare real-time data with historical data (7 days or 30 months) to track sudden growth or dips in site traffic, spot trends, and discover certain areas that need attention for long-term growth.
Based on the comparative insights, they can evaluate performances of campaigns, stories, alter headlines, change the time of publishing, and take timely decisions without further delay.
6. Custom API Personalization
Just like the dashboard, users can customize, make a query, and export data through API access based on their specific business objectives. Be it tracking traffic through location, device, or author, every level of customization is possible through API access. Instead of following a pre-designed dashboard, users can design their own metrics, integrate the relevant data into their BI tools, refine their queries, save time, and perform in-depth analysis.
7. Custom Events Tracking
Every user interaction can help users understand their audience better, optimize their content, and create long-term editorial goals. Instead of counting on one-size-fits-all metrics, users can customize events such as paywall views, scroll depths, subscription rates, or other engagement rates. These actionable insights help them uncover patterns, analyze which content is driving conversions, and determine which user interaction can make a difference.
8. Multi-site Grouping Network
This makes sure users don’t have to switch between multiple dashboards and manage operations separately. They can simply segment the websites under a common category such as ‘Entertainment Site’ or ‘Travel Site’ and analyze the traffic of multiple sites of the similar category from a single dashboard. They can check which site is performing well, driving the maximum amount of traffic, or inspiring visitors to sign up for paid subscriptions .
Getting started with the Publytics Dashboard
The Publytics dashboard is designed keeping the publishers’ versatile needs in mind. From real-time data, audience insights, acquisition metrics or event tracking, it has all the important features that help publishers keep track of key areas and take data-driven decisions accordingly. Be it small-scale or large-scale publishers, every user can interact seamlessly with the dashboard and get valuable insights based on the combination of historical and real-time data. Here are some of the metrics publishers can track:
1. Site Preview
This is the panel which offers you a holistic view of your site’s performance. Here you can track real-time users, unique visitors, the duration of sessions, bounce rates, and active pages drawing the maximum amount of traffic. Apart from these, users can also check the device being used by the visitors, countries from which the maximum audience is visiting your site, and even their language. If you want to know more about your audience, you can click on the audience section in the maps section.
The calendar on top of the screen can help you select the time period and compare the real-time performance with the historical data.
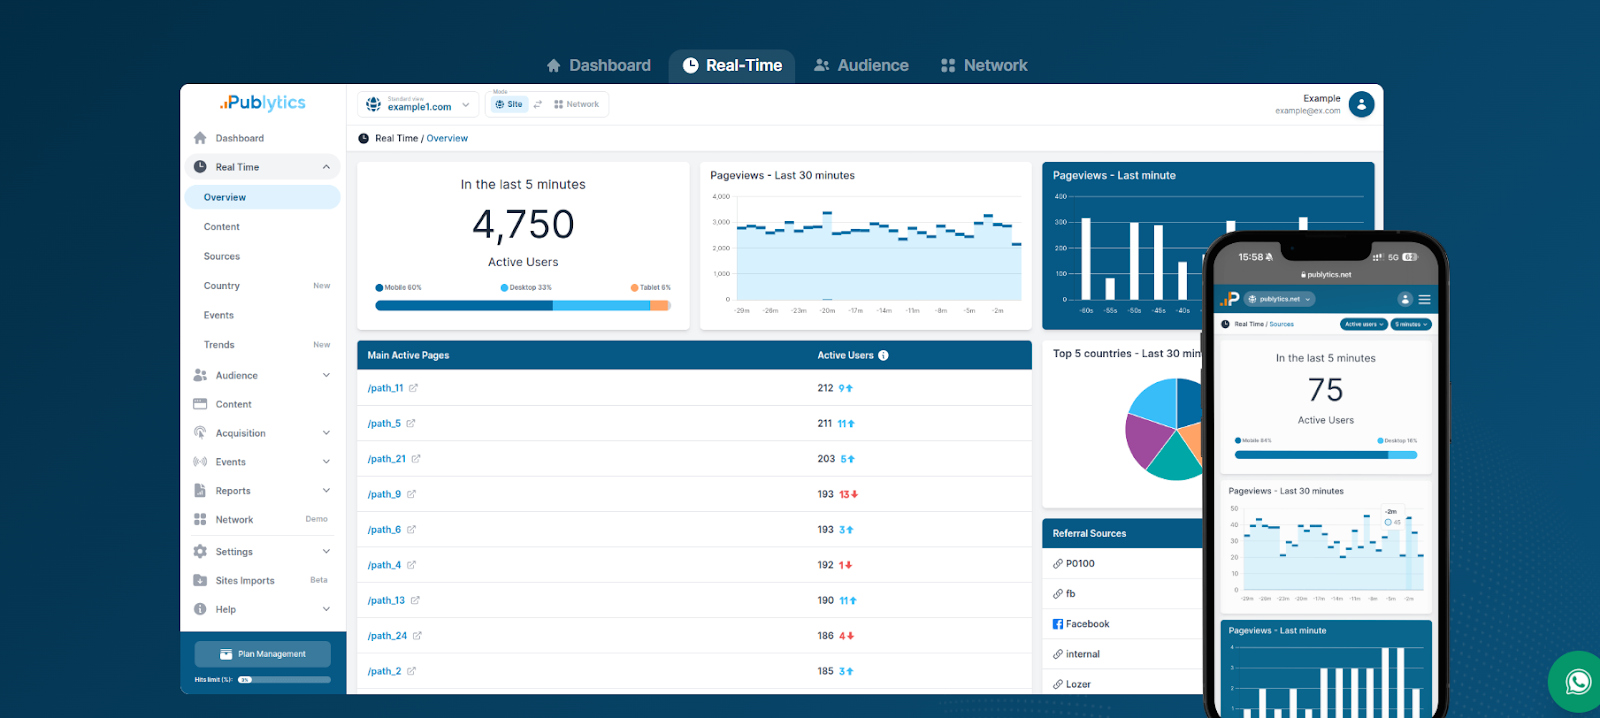
2. Real-time Section
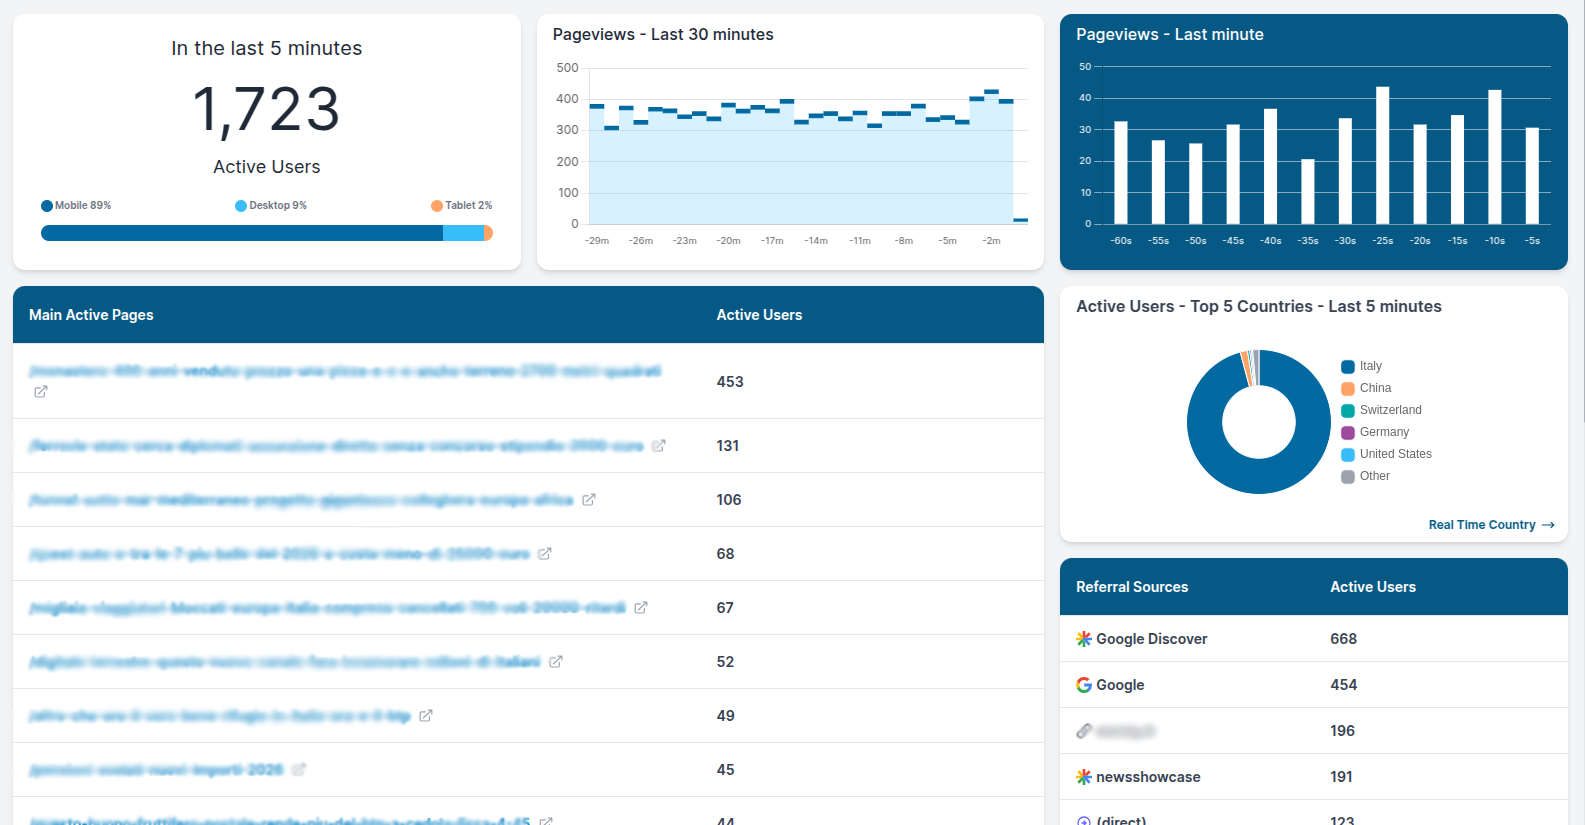
Users of Publytics do not need to wait long for updates. Through this section, they can get real-time updates of various important metrics that highlight the overall performance of the site.
Active users: This section can help you form an overview of active users of your site in last one minute, 5 minutes, and 30 minutes. You can also analyze the source devices of the users in this section.
Active pages: Through this panel, you can not only check the active pages but also the active users of each page. Besides, you can also track active pages for specific sources. You can also keep tabs on traffic from social networks through the Social Network Traffic table.
Content section: Through the content section, you can look for a specific page and check the active users, traffic percentage, and even the traffic sources.
Events: Be it clicking an ad, signing up for a paywall, or watching videos, users can track every step of the interaction of the visitors with the site, identify issues, and even take active steps to improve user experience.
Trends: This panel helps you keep an eye of recent trends (engagement rate or scroll depth) for the last one minute and do a comparative analysis with the trends of last week or last month to spot the difference and detect the changing patterns of the audience behaviour.
Money.it, a user of Publytics, found this feature extremely useful. They said, “After switching to Publytics, I’ve found it far more reliable than GA4, with smart features like Trends that keep me closely connected to my website performances.
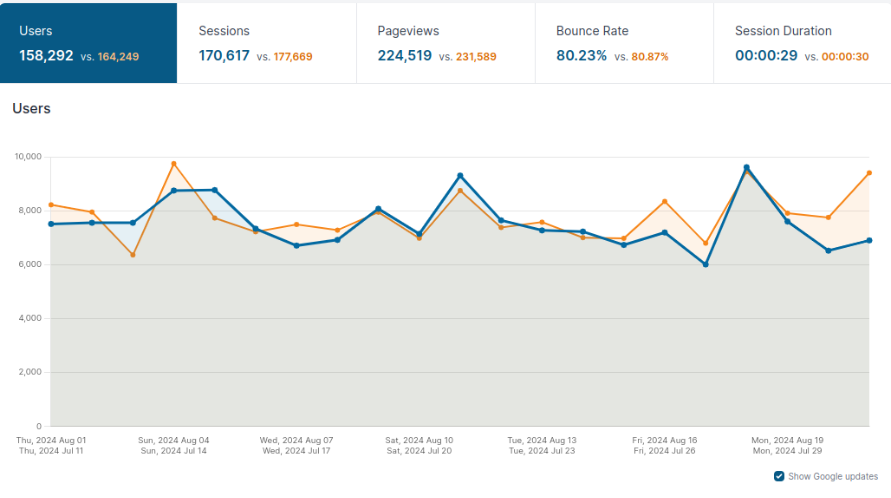
3. Audience Section
For publishers, this can be the most important section. You can check the audience who have visited the site for the last week and compare it with historical data with the help of the data range selectors.
You can also set up various parameters to conduct advanced analysis and cover every aspect of your user behaviour. From page views, bounce rates, time spent on a single session, exit rates, location of the users, and the devices used by them, there are detailed charts for each parameter that can help you gain actionable insights.
4. Network
This section is particularly useful for users who have to manage multiple platforms. Using this, they can keep a track of multiple networks, add specific dimensions, filters, or metrics and create reports using a single dashboard.
Users who have opted for the enterprise subscription can track unlimited networks, while the business plan subscribers can monitor up to three networks. On the other hand, the users who have subscriptions for the Lite plan can use the Network demo, but does not have access to all the features of the Network section.
Pricing
Each user has unique analytics requirements. For example, a tech publisher might have a specific requirement that is completely different from sports publishers. Keeping diverse requirements of publishers in mind, Publytics has come up with a versatile pricing subscription model that is primarily based on the features needed by the users.

Users can also use the pricing calculator, which guides them through choosing the subscription plan that best suits their requirements. It will offer users estimated monthly and yearly costs for each tier, based on their traffic volume and the page views they aim to achieve. This is a thoughtfully designed option that ensures users pay only for the features they need.
Enterprise Plan: This is the most comprehensive plan that offers many unique advantages to the users including access to unlimited team numbers,10,000 API Calls in an hour, importing historical data from various sources, and access to granular data based on real-time (hours and minutes). Based on their needs, users can add unlimited custom events, dimensions, metrics ,and even monitor the traffic of unlimited monitors and websites. The amount of data retention it allows is boundless. Additionally, this offers up to 250k pageviews in a month and is perfect for organizations that have extensive traffic and in-depth analytics reporting needs.
Business Plan: This is the most popular subscription plan among users. Perfect for budding publishing houses with advanced analytical requirements, it covers all the features of the lite subscription tiers and also offers other benefits. This plan allows access to 15 team members and 1000 API calls in an hour. Just like the enterprise plan, it also allows importing historical data from sources like Google Analytics 4. Besides, users can add 15 custom events, 10 custom metrics, 100 custom dimensions, track 20 websites, and monitor up to 3 networks from a single dashboard. This plan also offers 250 k page views in a month and retains data for about 10 years.
Lite Plan: This plan is perfect for small companies or online publishing sites that do not have extensive analytics requirements but want to cover all the fundamentals. It allows access to 5 team members, supports importing historical data, and retains data for 5 years. Users can track up to 5 websites, add up to 5 custom events and 10 custom dimensions.
The prices of the Lite and Business plans will vary according to your page views. For example, if you want 10,000 page views per month, the price of the Lite plan would be around €5 per month and the price of the business plan would be €10 per month. On the other hand, if you aim for 1 million page views, the price of the Lite plan would be €55 per month and the price of the business plan would be €110 per month.
Support
Publytics understands the needs and challenges faced by users and guides them every step of the way. In case users face any issue while setting up the account, adding dimensions, or understanding the analytics, there are multiple avenues to reach out to the customer support team. You can explain your detailed query and send an email to [email protected]. The customer support team will soon get back to you with a prompt solution.
In case the users need personalized solutions from the customer support, they can also send a WhatsApp message on +39 366 541 0354, or open a ticket through the dedicated button.
Users can also fill out the online form with essential details such as email address, the kind of assistance they are seeking, monthly page views, personal contact number, and the reference from where they discovered the platform, along with a descriptive message highlighting the problem they are facing.
In case users want to navigate the features all by themselves, they can go through the extensive documentation on the website. It provides detailed guides on setting up the account, advanced tracking, adding custom dimensions, navigating through the dashboard, API authentication, and more.
Publytics in Review
Here is what we truly loved about Publytics
- It features ZeroSample technology, which does not sample data and offers accurate results in a few seconds without leaving out a single data point.
- Even for pages with millions of page views, it can track huge volumes of data in seconds. Users do not have to wait for 1-2 days for finalized data, something common in traditional platforms like Google Analytics 4.
- It embraces a publisher-first approach that allows users to filter data by adding categories such as author, data, topic, or section. This granular data helps them go beyond surface-level metrics and aids comprehensive eeditorial planning.
- Users do not need technical expertise to analyze data through complex segment-based queries. Without coding or counting on API, they can do detailed analysis on the dashboard itself through filtering like SQL.
- The platform covers every important metrics related to traffic such as session time, active users, or scroll depth but does not compromise user privacy on any level. It is compliant with GDPR and CCPA, and is a reliable platform.
- The free trial period for 14 days allows users to explore all the features and understand all the benefits before choosing a fixed subscription.
- Users do not have to face a fixed tier pricing. They can interact with the pricing calculator and get an estimated cost for each month based on the page views they are expecting.
Areas of Improvement
- While the platform provides detailed analysis for all the metrics, the charts and graphs could be more refined visually.
- Though the dashboard is easy to use, adding custom dimensions might be challenging for users who are not acquainted with the technical intricacies of analytics. For famous CMS like WordPress, though, the integration is automatic and does not require additional technical expertise.
- The documentation does not feature detailed case studies that might help us assess how the platform adds value to the users.
Final Thoughts
More than just a regular analytics platform, Publytics is a forward-thinking intelligence platform designed with publisher intelligence in mind. From zero-sample technology, customizable features, event tracking, engagement metrics, multi-network monitoring, to API access, and granular analytics, it offers all the features that help publishers know their audience inside and out and create a content strategy that perfectly resonates with them. The thoughtfully designed features make the concept of data tracking easy for media organizations, online publishing houses, and content-based platforms.
Leveraging the customization options of the platform might need technical expertise. Though this might offer a learning curve to small companies with limited resources, we recommend Publytics as a new-age analytics platform for publishers who want to strike the perfect balance between data accuracy and privacy, and make data-backed decisions that have a meaningful impact on their growth.