Publisher growth tactics for election season | WEBINAR


Formerly known as Google Data Studio, Looker Studio is a free data visualization tool that enables users to create data-driven, easy-to-understand reports and dashboards.
The Google tool is available on mobile and desktop web and allows users to connect to multiple data sets, including –
What’s more? Looker Studio offers report customization features that allow users to add text, imagery, videos, hyperlinks, etc. They can further select fonts and color themes aligning with their brand style.
Leverage Looker Studio’s features to highlight and explain key data points in your reports. This can help enhance the engagement quotient while sharing valuable insights. Besides, Looker Studio allows you to share these reports with internal team members, clients, and others with quick access.
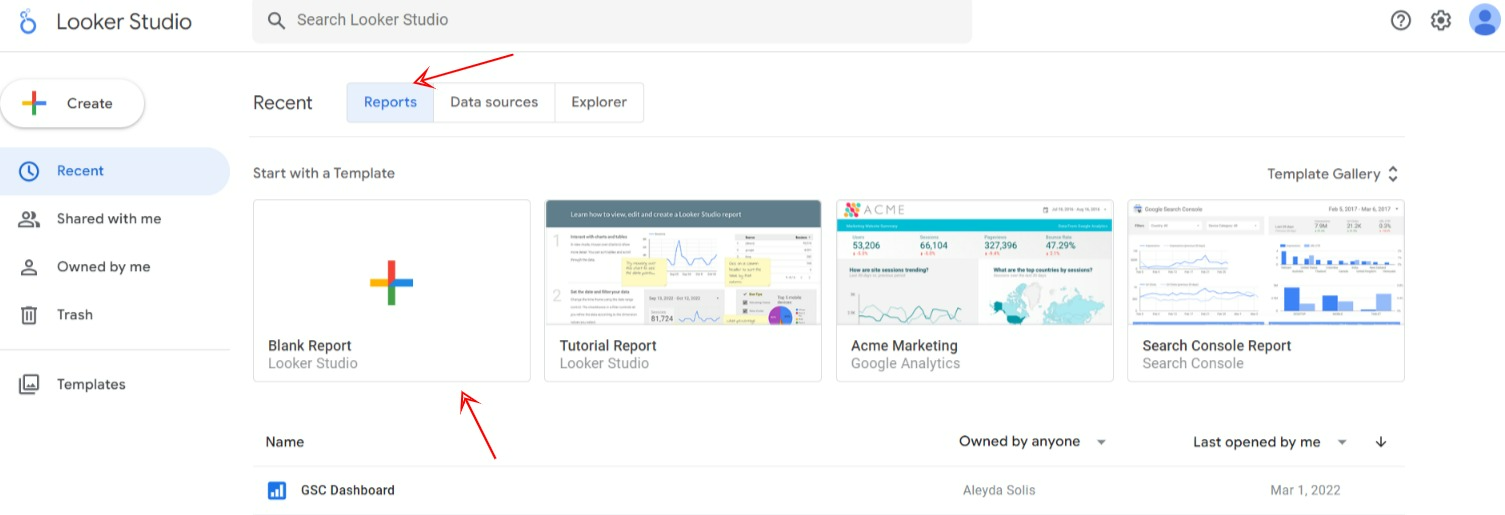
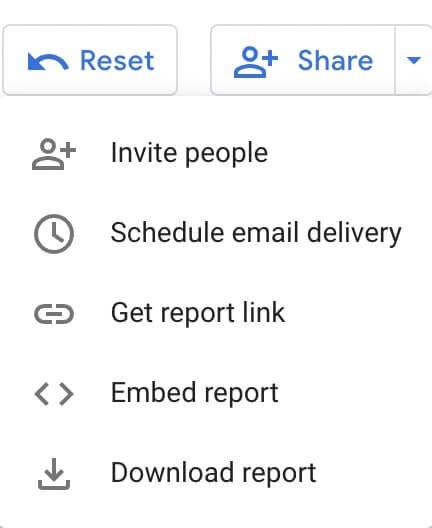
Here’s an example depicting its report-sharing functionality.

Click the “Share” button, add people, and set the access permission to “edit” or “view” as per your business needs. You can also share the link via emails, publishing on the web, or export them as PDFs.
Deriving valuable insights from complex data and presenting it to the team, clients, and C-suite to foster decision-making is a big challenge for publishers. Data visualization tools like Looker Studio help present statistics, trends, and other data in a more tangible way. The tool offers customized report creation provisions to ease their struggle. This makes it a must-have tool for publishers.
However, Looker Studio is more than a handy tool for creating informative, appealing, and customized reports. When used wisely, it can help publishers improve business strategies.
Here are the top reasons why publishers should care about Looker Studio.
Looker Studio can help publishers analyze their website traffic by tracking key metrics, such as page views, average visit duration, top pages, exit pages, bounce rate, conversion rate, and traffic by source, location, and more.
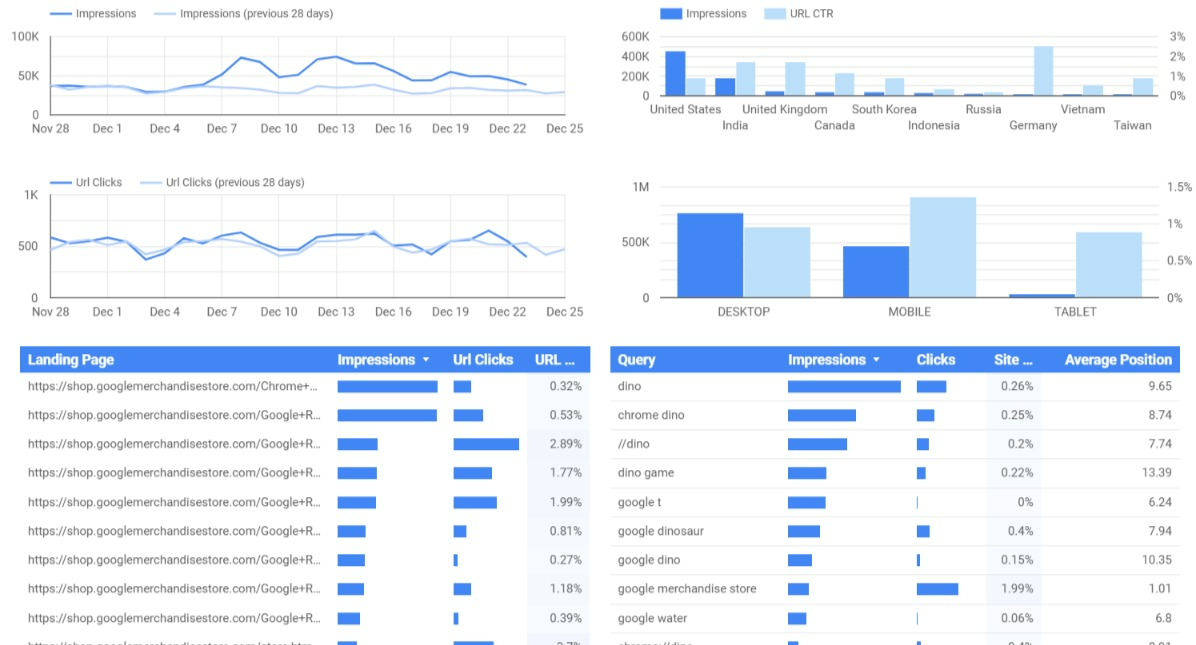
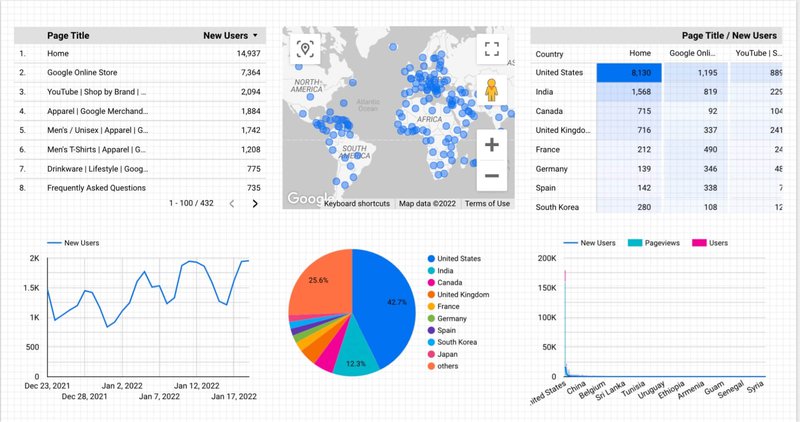
To do this, publishers need to connect their website’s Google Search Console and Google Analytics accounts to this platform to generate these reports. For instance, observe the following Looker Studio report depicting organic traffic and engagement trends.
Publishers can also leverage this tool to create funnels depicting how visitors move through their websites. For this, they should open the “Conversions” tab and click “Funnel Visualization” to add pages.
Looker Studio will display the number of visitors entering and exiting the funnel at each stage. This practice can help them figure out areas of improvement and create marketing strategies to boost traffic.
Publishers can connect their Google Search Console account to Looker Studio to track their keyword rankings and analyze their SEO strategies. Unlike paid keyword rank tracking tools like Ahrefs and Semrush, publishers can monitor keyword rankings in one place with Looker Studio – for free.
Here’s how –
The tool enables publishers to identify keywords with the highest search volume that drive relevant website traffic. Optimizing website content using these keywords can further maximize traffic and improve rankings in SERPs.
Besides, analyzing keyword rankings can help publishers understand the specific reason for traffic drop, including technical errors and penalties, and build site performance improvement strategies. What’s more? Publishers can track keywords their top competitors are ranking for or missing out on. Leveraging these insights can help them make informed decisions and gain a competitive edge.
With Looker Studio, publishers can create a custom report highlighting –
For instance, check out the following keyword analysis report template. Creating such reports can help publishers identify new SEO opportunities.
![]()
A report by HubSpot affirms that the human brain processes visuals 60,000 times faster than text messages. Thus, visually stellar content on social channels, such as Twitter, Facebook, and LinkedIn, can help publishers enhance engagement.
They can achieve this by copying and pasting the report’s URL into that site’s posting field. They will automatically receive a screenshot image with a title, description, and a shareable report link. This social media content distribution practice can help them drive traffic to the website and fetch new business opportunities.
In addition, Looker Studio empowers publishers with data on their social performance and insights into how they can improve their strategies. For example, publishers can link data sources, such as Facebook ad tracker, YouTube ad tracker, and others, to the Google Analytics connector in Looker Studio. This allows them to track metrics like traffic, clicks, impressions, and more from social media ads.
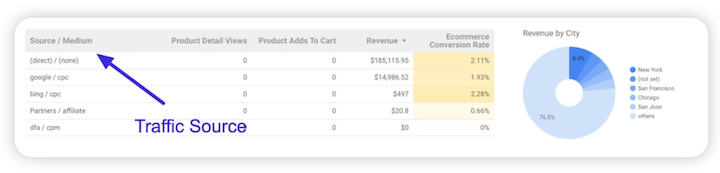
Here’s an example depicting how Looker Studio helps identify traffic sources.
Google releases new feature updates of Looker Studio regularly. Since its introduction in March 2016, the tool has been updated over 100 times. One of its recent updates enables publishers to visualize dimensions, such as User Ad Distance, First Position Bid, and more, using the Ads connector.
Another update launched a few months ago was about the new “Data” panel in the “Properties” panel. This panel lists all the data sources and enables publishers to expand and access their parameters and fields for creating reports. This reflects publishers can always expect to find improved ways to create business reports.
Now that you have understood how Looker Studio can help visualize vast and complex data, you should learn its fundamentals to leverage it to maximum potential.
This section will guide how to create and customize action-oriented reports by integrating your business data into Looker Studio.
Here’s a step-by-step process to generate a report in Looker Studio.
#1: Sign In to Looker Studio
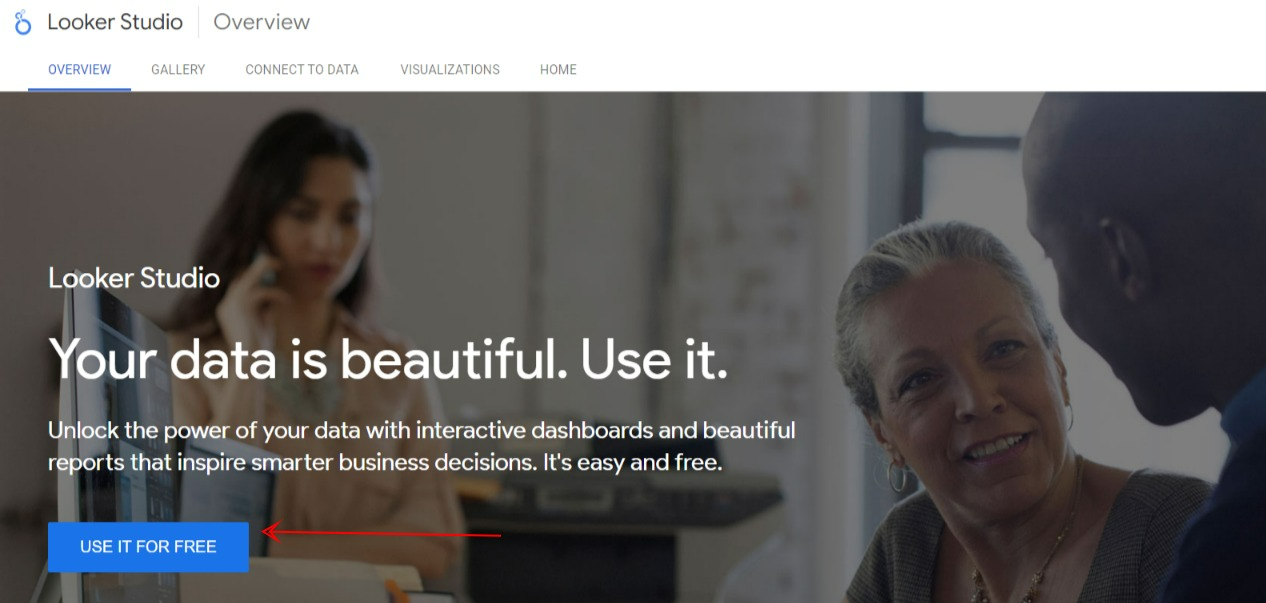
Visit the Looker Studio website: https://datastudio.google.com/ and click the “USE IT FOR FREE” button. Sign in by entering your Google account credentials.
#2: Connect to Your Data Sources
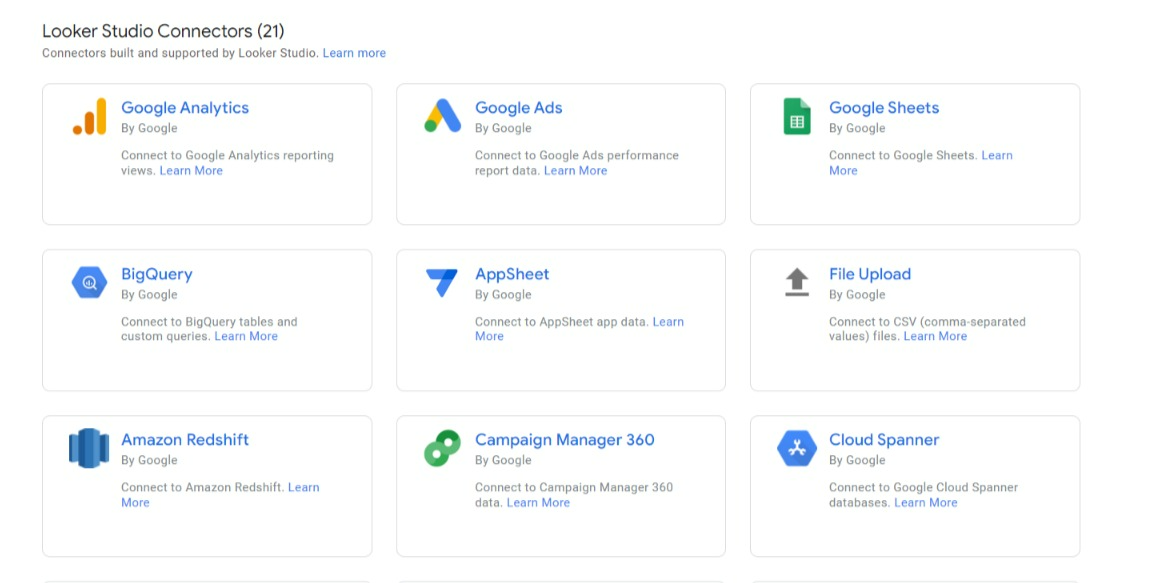
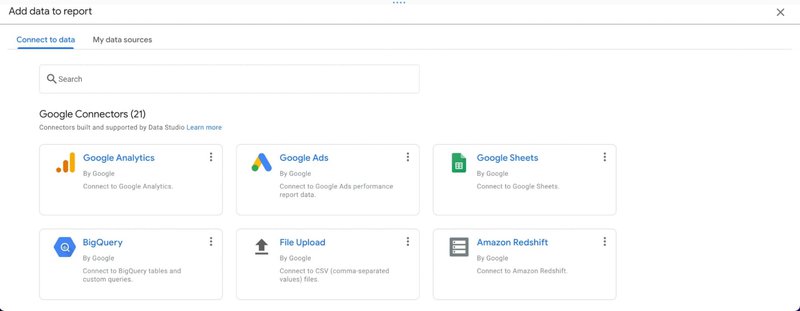
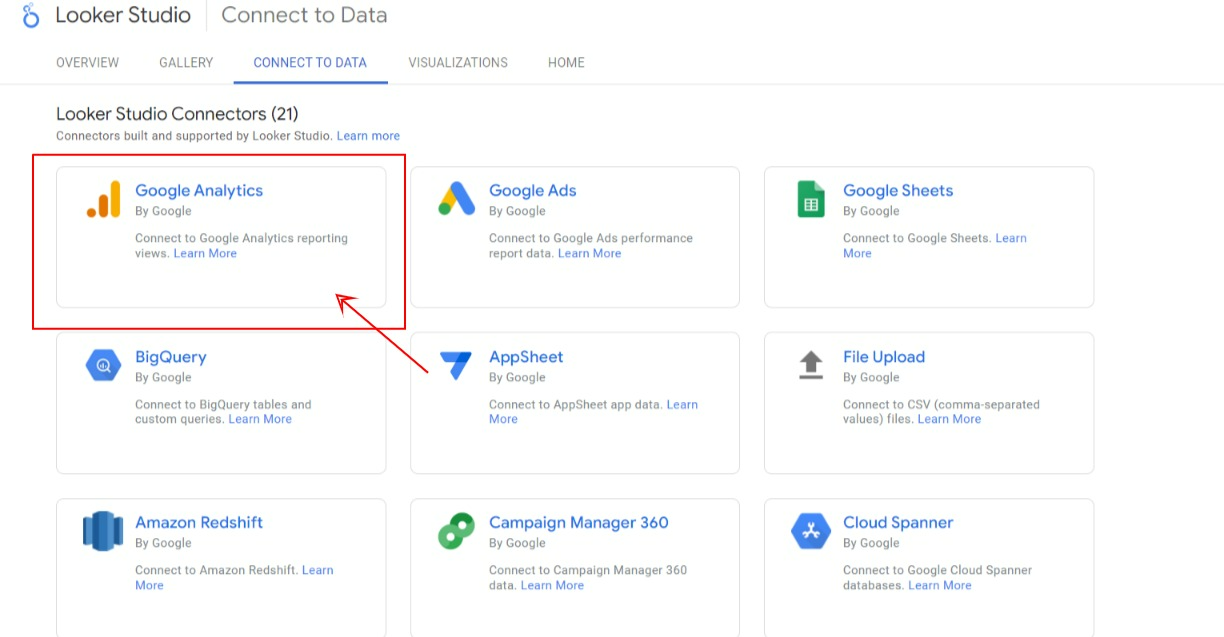
Connecting to data sources is the first step to creating reports. To do this, see the menu and click on the “Data Sources” button.
Choose from connectors like Google Analytics, Google Sheets, Google Ads, YouTube, Facebook Ads, BigQuery, SQL database, and more. These connectors help connect Looker Studio to the underlying data.
#3: Create a New Report
Next, click the “New Report” option in the toolbar to start report creation.
Leverage an existing template or build a dashboard from scratch by clicking the “Blank Report” option. Ensure adding an appropriate report name to avoid confusion while searching the file afterward.
#4: Add Charts and Controls
Charts are the vital components that enable publishers to visualize data, while controls help them interact with that data seamlessly. For instance, you can choose a date range, apply a specific filter, or provide input to a parameter. This makes reports interactive by allowing users to customize and view the report’s data.
On the other hand, you can select from distinct chart options as shared below.
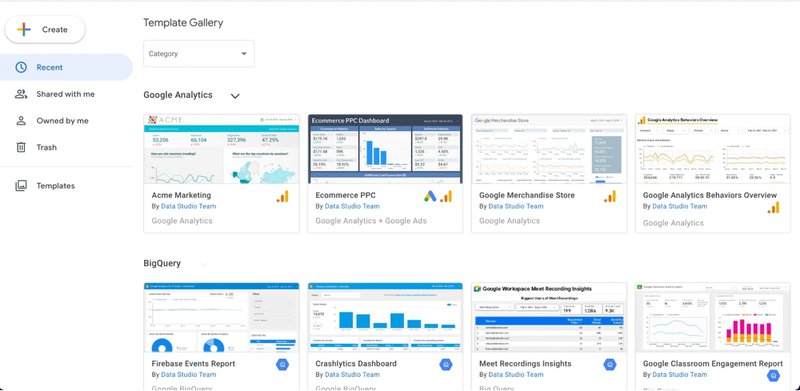
#5: Select a Template
If you decide to go with an existing template, go to the list of pre-made templates. They are categorized based on the data integration you desire to use.
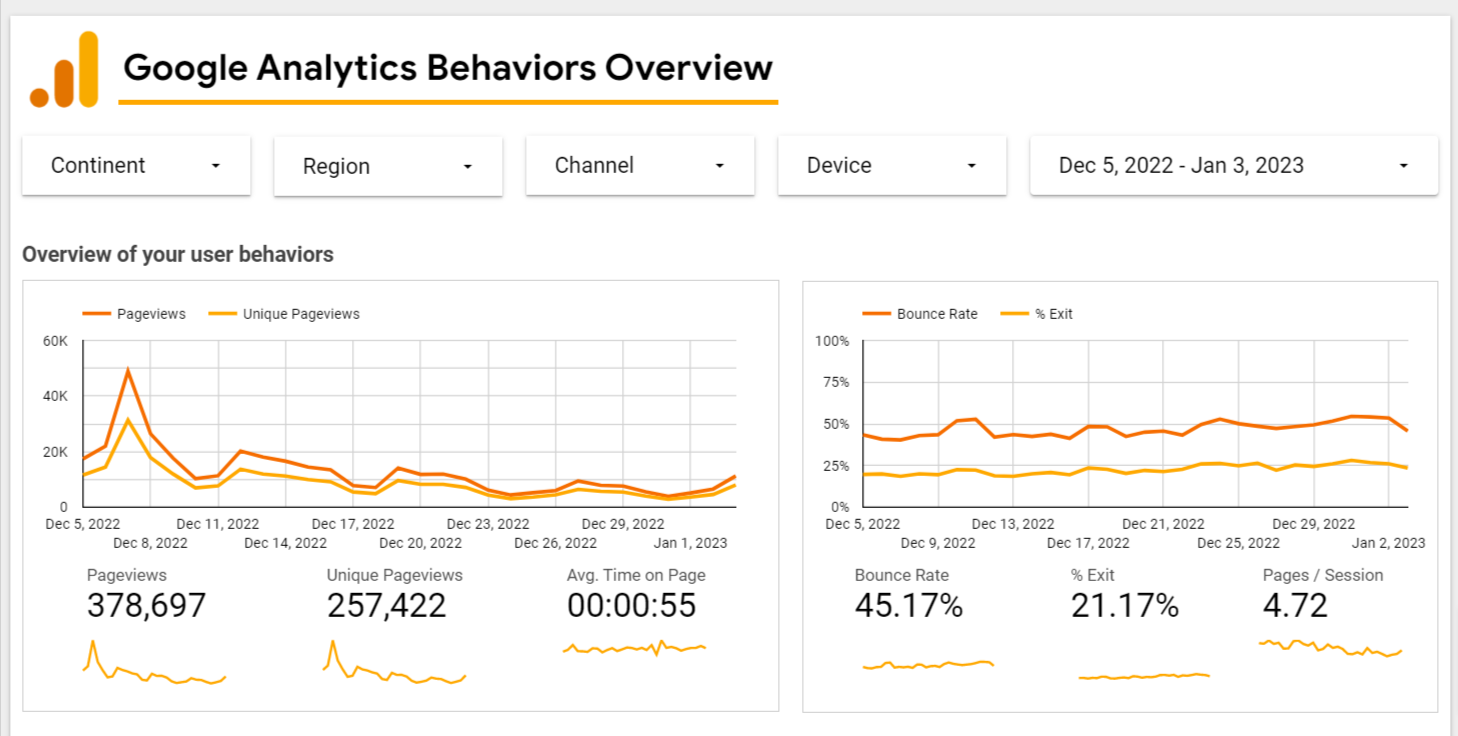
For instance, publishers can create a custom Google Analytics report using Google Analytics Behaviors Overview. The report shares insights on individual pages, giving publishers information unique pageviews, average time spent on each page, bounce rate, and exit rate.
#6: Add the Data
Drag and drop the desired data from the data sources. In addition, you can also use “Google Connectors” to filter and add calculated fields to the data.
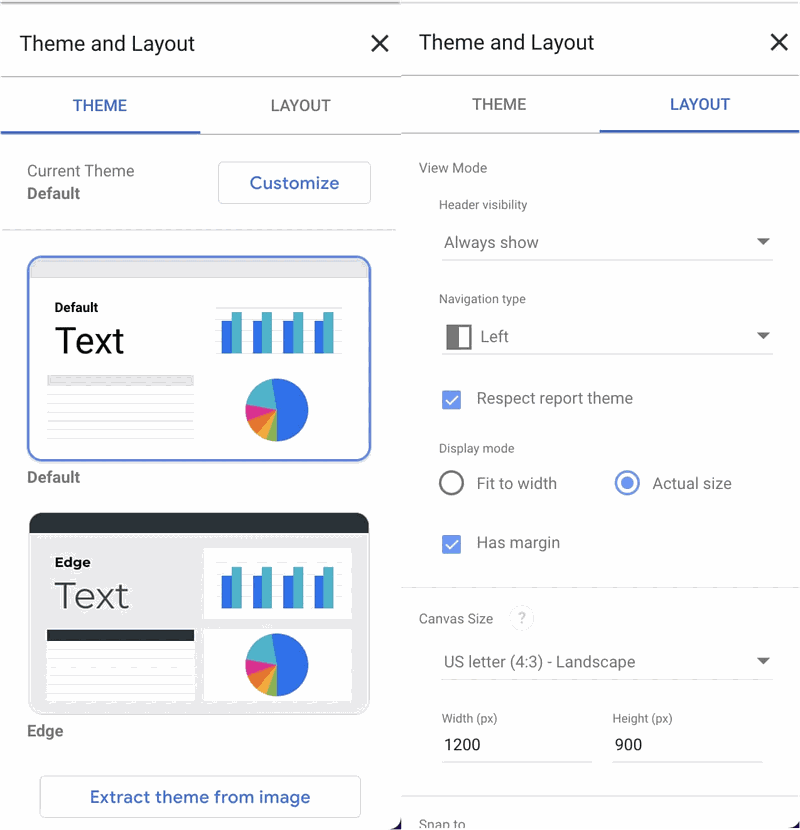
#7: Format the Data
Looker Studio offers various options to format the report data. For instance, you can change the color scheme, font, text size, background color, and more. The style tab on the right can further help control the appearance of components of the dashboard.
Experiment with these features and save the final version.
This empowers publishers to understand and communicate accurate, actionable business insights and trends and foster decision-making in the organization.
#8: Share the Report
As we mentioned, you can share the report with your teammates, clients, or other stakeholders by sharing the link directly, scheduling email delivery, exporting it as a PDF, or publishing it on the web.
You can also embed the report link in social media posts or blog posts to share valuable insights with the readers in an easy-to-digest format.
Since Looker Studio is a helpful data visualization tool, you can leverage it to understand and present SEO insights to teams, clients, and C-suite to foster data-driven decisions. As we already explained, you can connect your Looker Studio to your Google Analytics account and track crucial SEO KPIs, such as top keywords, traffic, page impressions, and more.
First, decide on SEO KPIs that make sense for your business. For instance, include email list opt-ins, sales from SEO (eCommerce), newsletter signups, new visitors, and total contact forms submitted.
Let’s now dive right into the steps to build an SEO dashboard in Looker Studio.
#1: Connect to Your Data Sources
Follow the steps below to connect to your data sources.
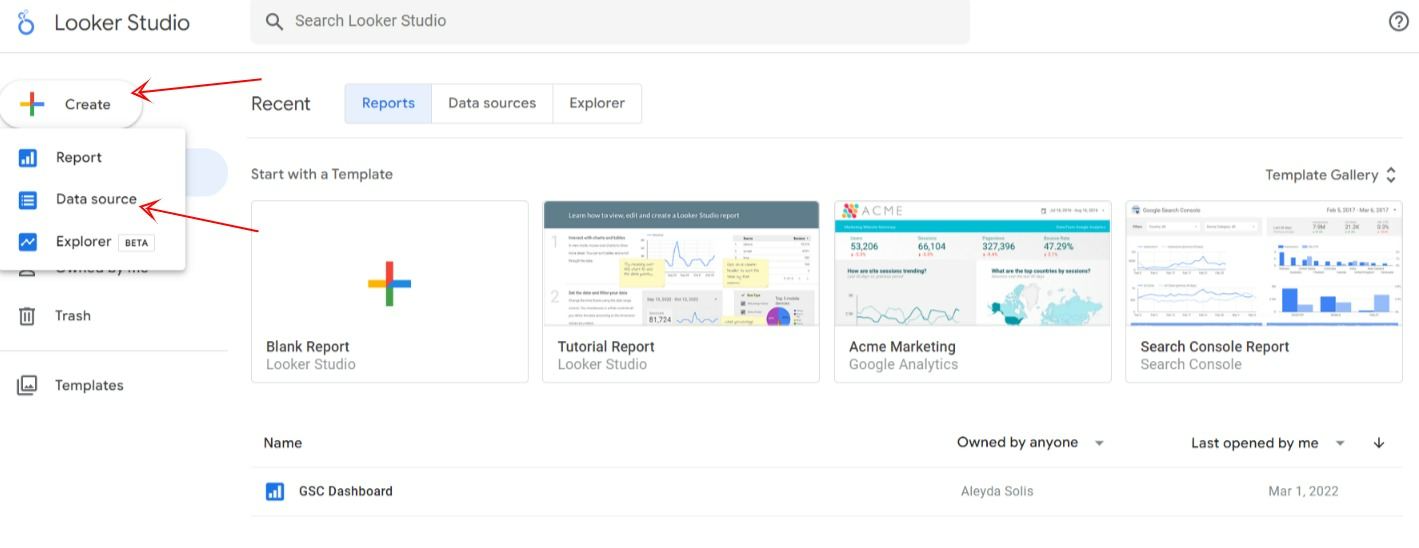
Step 1: Log in to your Looker Studio using your Google account. Click the ” CREATE” button on the top left and select the “Data source” option.
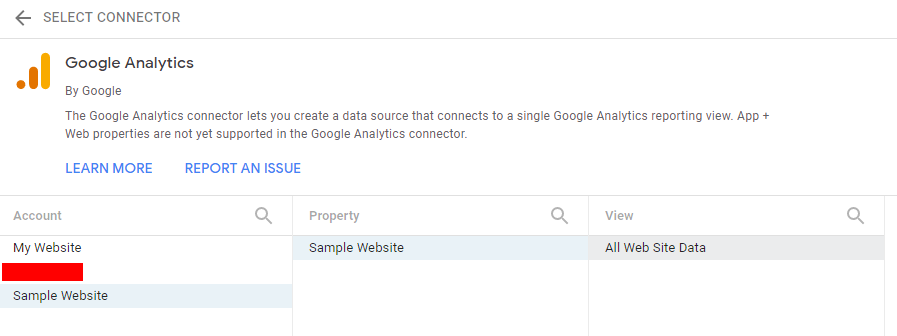
Step 2: Choose the “Google Analytics” connector.
Step 3: Next, Select the Account, Property, and View. Click the “CONNECT” button to load the data into Looker Studio.
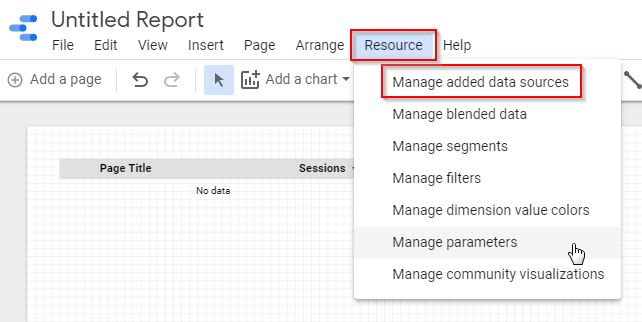
#2: Add Another Data Source
Click “Resource” on the main screen to add the second data source. Select “Manage added data sources.” This will help you manage all the data sources in one place.
If you click “ADD A DATA SOURCE,” it will direct you to the list of data connectors. Choose a connector and follow the same steps we explained previously.
If you want to add data from Facebook Ads or Bing Ads, scroll downwards to the “Partner Connectors” section and choose the data source. Next, you need to add KPIs to your dashboard.
#3: Add a Line Chart
A line chart can help you track crucial KPIs for the website.
Follow the below-shared steps to add a line chart.
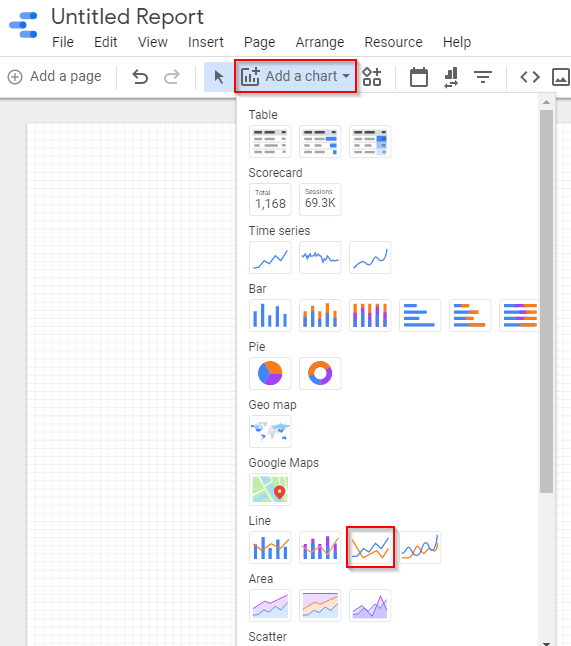
Step 1: Select “Add a chart” from the toolbar to explore the list of charts. Next, click the “Line chart” option from the “Line” section.
Step 2: Drag and drop a suitable chart into the dashboard and choose the metric you want to highlight from the toolbar on the right.
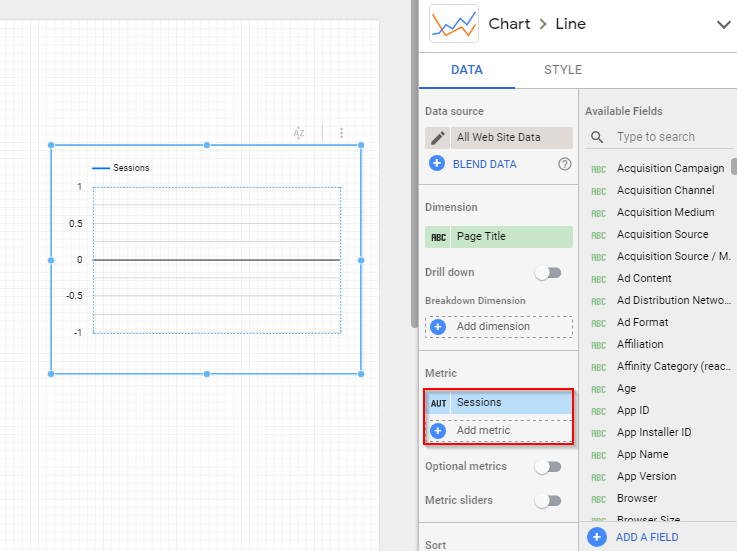
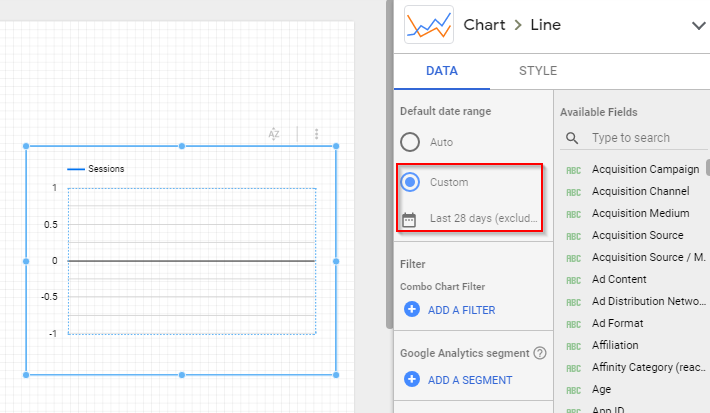
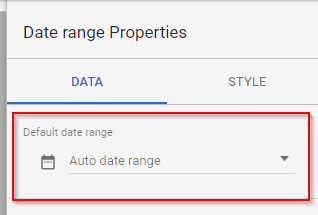
Step 3: Scroll downwards to see the “Default date range” section and include the previous period date comparison.
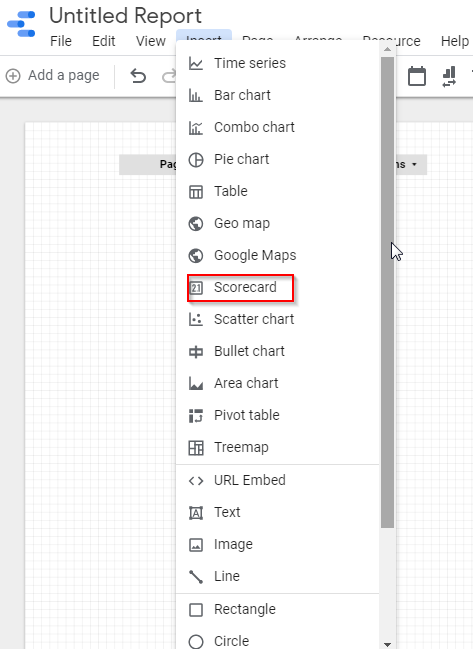
#4: Add a Scorecard
A scorecard enables you to track the following KPIs.
Follow the below-shared steps to add a scorecard.
Step 1: Select “Insert” from the toolbar and click “Scorecard.”
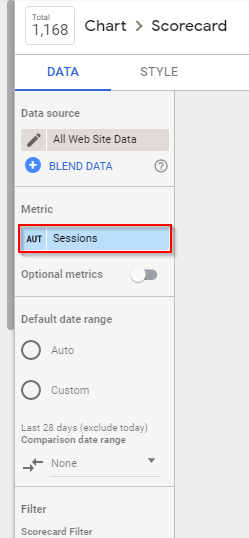
Step 2: Drag and insert the scorecard in the dashboard and choose the metric you want to highlight from the toolbar on the right.
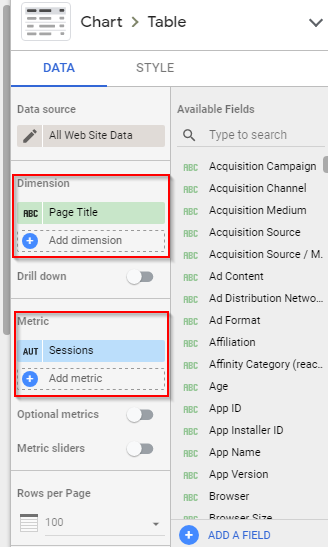
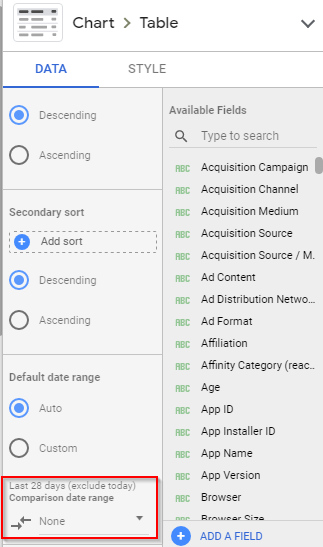
#5: Add a Table
The table helps track the following KPIs.
Follow the below-shared steps to add a table.
Step 1: Select “Insert” from the toolbar and click “Table.” Next, drag and drop it on the dashboard.
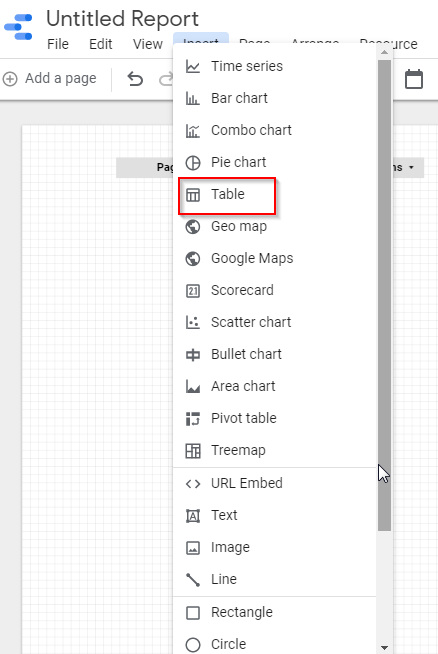
Step 2: Select the dimension (which reflects the table’s main column) and add the metric.
Step 3: Select the previous date range comparison.
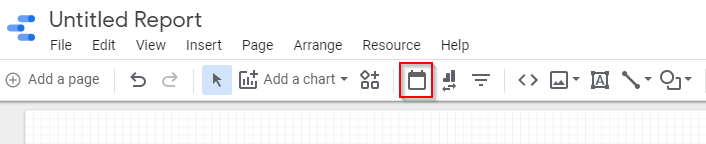
#6: Add a Date Slicer
The date slicer can help adjust the data’s timeframe.
Here’s how to add it –
Step 1: Select the “Date Range” icon from the toolbar.
Step 2: Drag and drop it on the dashboard and choose the default date range.
Congratulations, your SEO dashboard in Looker Studio is now up!
#7: Share Your Dashboard
Click the “Share” button on the top right corner to share the SEO dashboard with your team, client, and others.
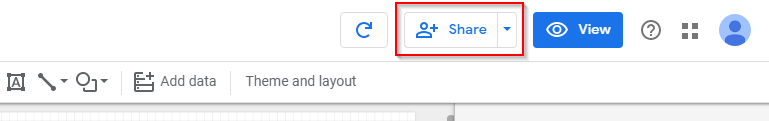
Enter their email addresses, give them viewing or editing access, and hit the “Send” button.
Now that you have understood how to create insightful reports in Looker Studio, let’s discuss some of its features.
Although we have already explained its key features, we suggest you go through the following attributes. These below-shared insights can help you make the most of this data visualization tool and achieve the best business outcomes.
Let’s get started.
Looker Studio lets you access your data from 800+ data sets from 700+ connectors. The data source connectors include Google Analytics, Google Ads, Twitter, Facebook Ads, and more. This provides the flexibility to create hundreds of helpful reports in an easy-to-understand format and track your business’s performance.
Looker Studio allows embedding external content to make the reports more insightful. For instance, you can add video tutorials, imagery, and maps and boost its engagement quotient. Select the “Add element” button in the Looker Studio report editor and click “Embed content.” Select the type of content to generate the report.
Schedule and send reports to your team and other stakeholders. Visit the “Settings” tab in the editor and click the “Schedule report” button to specify the date, time, and recipients. They will automatically get a copy within the specified timeframe. This can be a great way to share the latest reports and keep everyone on the same page.
Looker Studio lets you download any report as a CSV file and simplifies importing the data into third-party applications for further analysis. Select the “File” menu toggle in the editor and click “Download As” to choose the file.
Adding notes to the reports can further simplify data visualization and enable recipients to understand complex concepts without hassles. To add notes, go to the “Notes” tab in the editor and add the text. You can also format it with Markdown.
Though Looker Studio is a state-of-the-art tool, you may encounter several errors and technical glitches. Here, we will discuss those challenges and tips to resolve them.
You may receive an error message stating “Invalid Metric” or “Invalid Dimension” while adding these variables to the filter. Looker Studio highlights these erroneous fields in the “Properties” panel of the graph. This can happen when publishers change the data source connected to the graph or report. It can also occur when they change the data source structure.
Pro Tip: If you have purposely changed the data source, add the desired dimension or metric. If you haven’t, click “Refresh Fields” or reconnect to the data source.
Looker Studio comprises two types of data sources –
The first category of data sources gets renewed automatically every time you open the report or change the time window. However, Google Sheets that require manual updating fail to update as the browser’s automatic refresh functionality doesn’t work them. The outdated data may result in erroneous reports.
Pro Tip: Since Google Sheets require manual updating, update it by clicking Looker Studio’s “Refresh” button.
Looker Studio requires dates to be in the following fixed format:
| YYYYMMDD[HH: MM: SS] |
The tool fails to identify dates in any other format. Data sources with fixed schemas, such as Google Analytics, provide Looker Studio with the desired date format. On the other hand, data sources with flexible schemas, such as BigQuery or Google Sheets, may cause issues with dates. This may lead to an incorrect visualization of data comparison as per their dates. This can impact decision-making and lead to financial losses.
Pro Tip: Reformat the dates as per the Looker Studio’s date format.
Reports leverage data from various sources for better visualization. Looker Studio’s report filter may be inefficient in filtering data from two sources because of its inability to combine fields from different sources.
Pro Tip: Create a field in all the data sources using the same Google Id. This signals Looker Studio to combine the fields in the different data sources. Use this field as your report filter.
As we already explained, report links can be shared via emails to teammates, clients, or other stakeholders. Let’s say you receive an email with a link to a Looker Studio report. Ideally, when you click on the shared link, it should display the content. However, in some instances, it may not show anything.
Pro Tip: This usually happens when users try opening the report without logging in to Looker Studio. Ensure you have logged into Looker Studio using the appropriate Google account.
Your MySQL connection can stop working and display an error message “Connection does not exist.” This could be a performance issue.
Pro Tip: Create a new view in your database that comprises the report data. Create a new MySQL connection and select the newly created view. This should solve the problem.
Although Looker Studio is an excellent tool for creating reports and SEO dashboards, it has a few limitations.
To overcome these limitations, we suggest you use readymade SEO dashboards rather than building your own.
Looker Studio is a powerful data visualization and analysis tool that lets publishers create insightful reports using visual elements like graphs, charts, maps, and more. From creating insightful SEO reports to several other business-related reports, you can turn numbers into compelling narratives.
Its easy-to-use features and functionalities make it the most sought-after solution for publishers.
After reading through this post, you should be able to understand everything about Looker Studio and the best ways to leverage this free tool by Google. So, go ahead and make the most of Looker Studio.