Publisher growth tactics for election season | WEBINAR


Google committed $300M (in total, including future investments) for its Google News Initiative in July 2018 as a part of the funding for independent journalistic projects. Google, Internews, and DataLEADS collaborated on this effort, while BoomLive, Alt News, First Draft, and Storyful provided technical and programmatic assistance.
Many media outlets, including BuzzFeed, Business Insider, and Conde Nast, have been using (and have used) News Consumer Insights (NCI, a product by Google). It focuses on providing valuable data for publishers who usually collect the same via Google Analytics. This helps identify and analyze potential paying subscriber categories based on how users engage with the content.
And now, Google has built on the NCI product with a new tool called Real Time Content Insights (RCI). RCI is dedicated to keeping publishers up-to-date on current events and helping them explore trending stories that could bring in more viewers. It empowers news publishers to uncover the underlying news stories that are insightful to their readers and keep them coming back for more.
NCI data was more valuable to the publisher’s business or audience development teams. But, RCI adds value for editors and authors by helping them understand the dynamics of the content on their site. This includes identifying what is trending, what’s dropping off, and what’s gaining momentum.
The new tool, RCI, is here to help with —
If you are a publisher or a media house, use RCI to check posts that are getting the most attention from your audience and which bigger subjects are trending in your area. You may use Real Time Content Insights with any version of Google Analytics to bring interactive data visualization into your newsroom.
Let’s explore the other benefits it offers to publishers.
You can track content performance across different formats — Google Search, YouTube, Display Ads, and more. This helps identify how your content is fairing across various channels.
It involves gauging comments, likes, and shares that each piece of content receives as a testament to audience interaction. RCI, in this manner, makes way to improve content effectiveness by providing data-driven insights into user engagement.
Moreover, it helps to render the following advantages—
Real time website data can help you track their content’s performance across search engines, social media, and other channels. Use this data to discover improvement areas and optimize content that ensures greater engagement and visibility.
There is a use case where digital content publishers have leveraged such insights by using Google News initiative. The Long Beach Post analyzed their readers’ preferences and discovered that most of them were using mobile devices.
They used the combination of AMP and submitting pages to Google News Sitemap. This helped news stories to appear in the Top Stories carousel, driving prominent visibility with over 10x more rich results impression.
You’d usually work to frame keyword strategy, make an editorial schedule, and publish content consistently. With RCI, you can accomplish those things better by identifying how the audience perceives and interacts with your articles in real time. Leverage RCI to craft winning responses that cater to readers’ expectations.
The increasing number of search queries never gives you enough chance (and time) to cater to an inquiry. And this is where RCI helps with historical-based SEO insights come in.
Time-sensitive queries are rising, reflecting:
Cater to what your readers usually search for based on viral time-specific information. And then implement SEO around such queries to gain maximum and relevant readership.
Serving users what they like to consume is one of the best ways to improve their experience. Leverage RCI to avail Content Engagement Rank (CER). It provides comprehensive engagement indicators, such as recirculation, casual readers, devoted readers, and other engagement metrics.
You can skip through the content that doesn’t interest your audience based on criteria like author or topic. Blend in components like Reader Engagement and Reader Revenue from the News Tagging Guide to ensure that your posts perform better, guaranteeing an enticing experience for readers.
The easiest way for site owners and marketers to keep tabs on conversion rates is to use real time data to improve conversions. An ideal conversion for publishers is users spending N amount of minutes on a particular article, readers liking or commenting on it, or signing up for the newsletter, etc. Real time tracking can help track and monitor an ad campaign to drive conversion.
For instance, when the engagement on your website begins to drop, you might encourage influencers to promote your campaign on their social media channels, such as Instagram. Or, push your ad campaigns to certain geography to improve audience reach.
Unexpected events like breaking news may require you to take action outside your planned campaign. And as the story develops, you’ll likely need to take swift action. RCI gives greater control to include relevant content on your homepage or quickly inform your readers of the situation to gain first-to-publish advantages.
Dainik Jagran: One of the highly circulated newspapers in India, Dainik Jagran, used RCI for their news website Jagran to track political discourse on Google Trends and Twitter during the 2019 general election. RCI helped the newsroom answer voters’ queries about the election, focus on the most important stories to their readership, and foster long-term loyalty.
This approach paid off on election day, with a 450% increase in traffic, a 180% increase in reader engagement, and a 300% increase in ad income.
Rappler: Like Dainik Jagran, the Philippines’ leading digital media company Rappler engaged in data-driven decision-making. This includes giving their staff the necessary data-analysis tools to leverage RCI to boost viewership and loyalty after the election.
Editors used it to track section performance in real time using RCI’s “newsroom” view and other data dashboards in their offices. This technique increased article reads per visit by 8% and average monthly readers by 16% year-over-year.
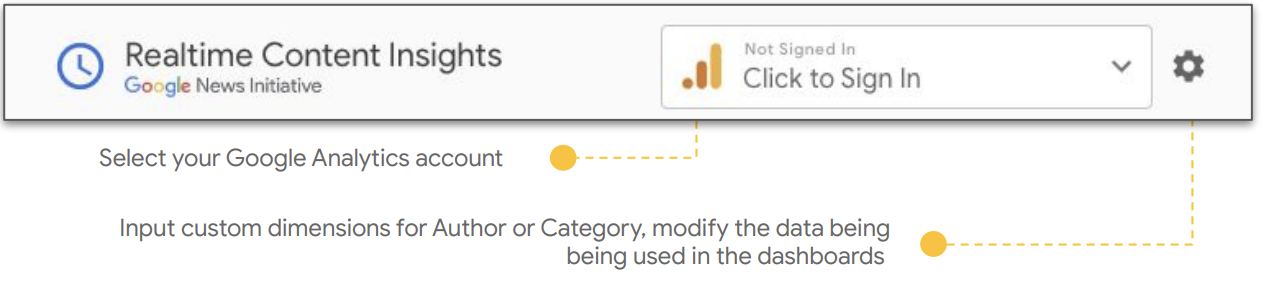
Get your publishing business access to Real Time Consumer Insights (at no cost). You must use your Google Analytics account email address to access the tool.
To start using it —
Note: You will see the below header with a settings icon to input custom dimensions
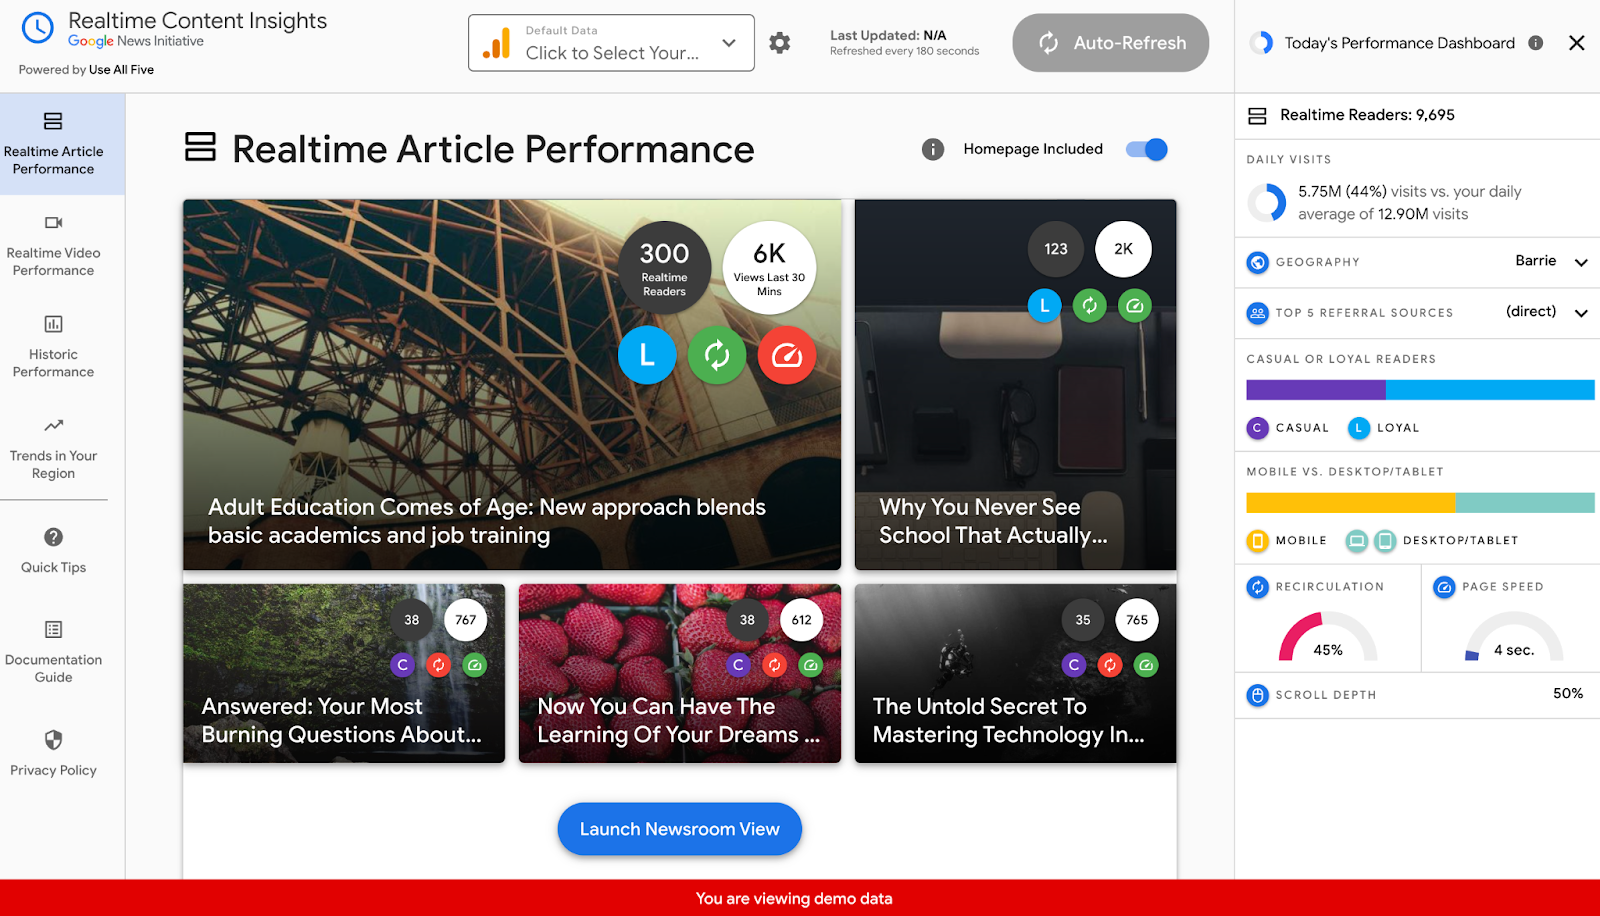
Screengrab: How the real time article performance dashboard looks like
Next, you’d want to avail article insights for particular articles.
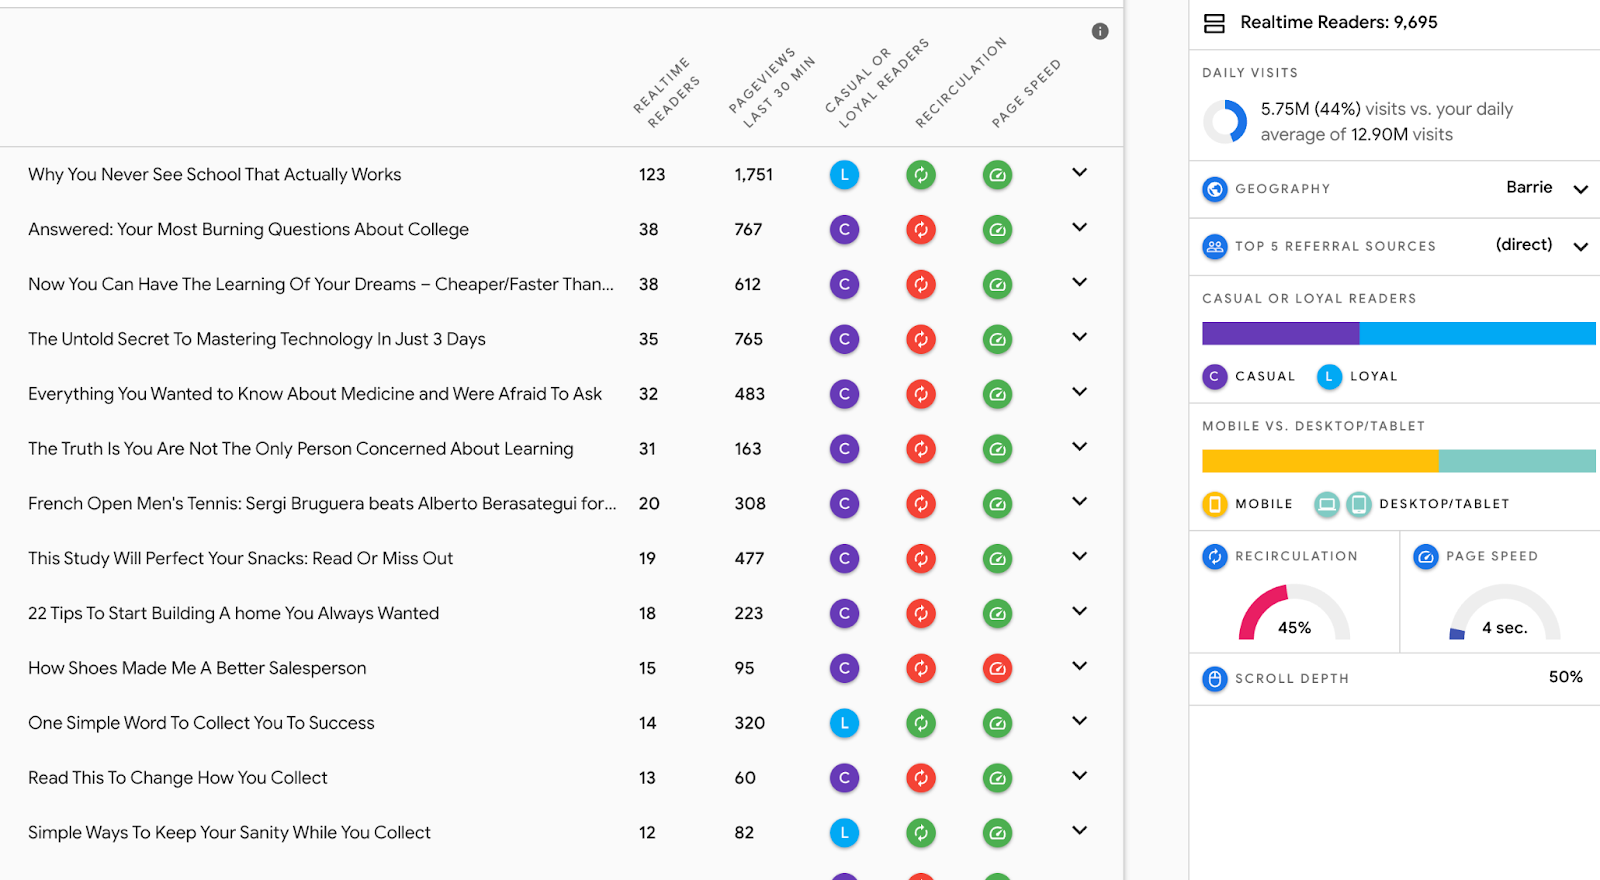
Scroll down, and you will see article titles with key metrics like real time readers, pageviews in the last 30 minutes, casual or (C) loyal readers (L), recirculation, and page speed.
Screengrab: List of published articles with a quick overview of key metrics
Next, click on any article to expand its RCI stats.
For example, we have selected the first article to avail a detailed analysis.
Here’s what you will see.
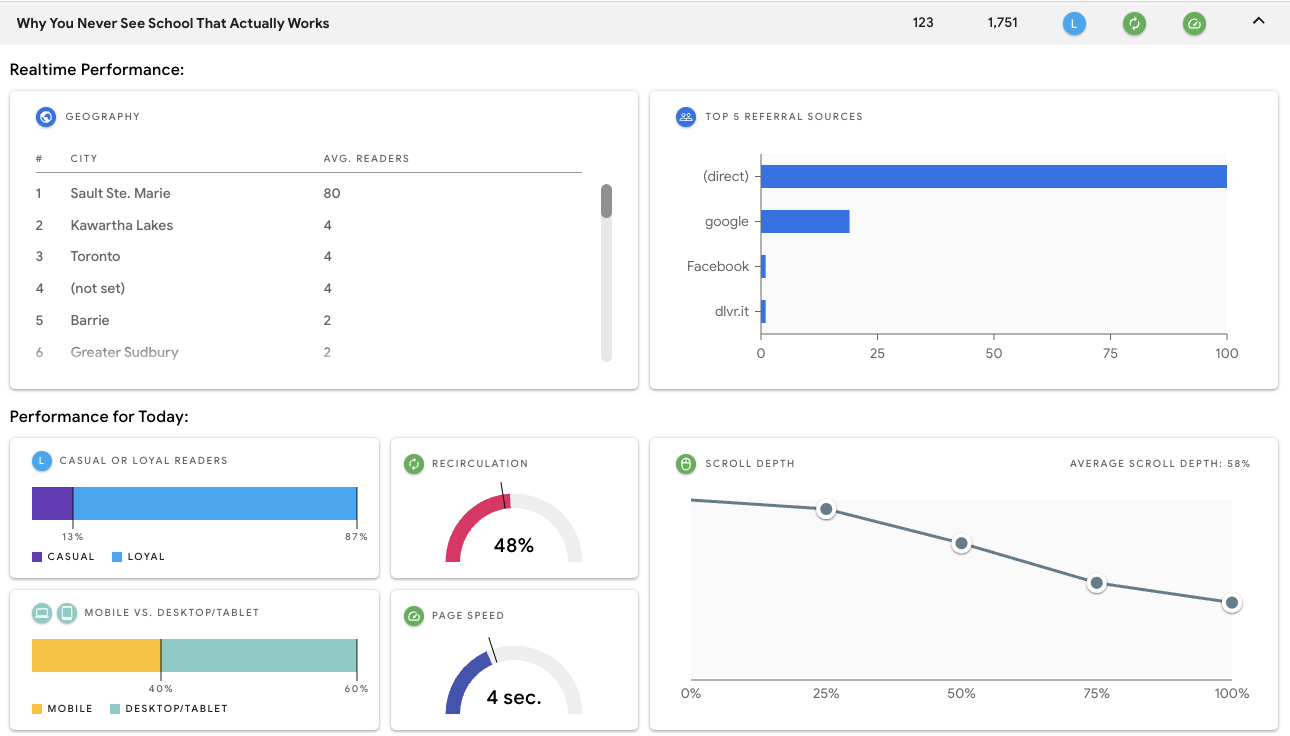
Screengrab showing the analysis of the chosen article.
Ideally, you’d want to focus on four key areas of performance —
Let us explore each in detail.
You can check the article table view, which displays live readership data and 30-minute pageview totals for each article. This data is based on the several real time readers who influence the rank of your articles, offering a breakdown of the following —
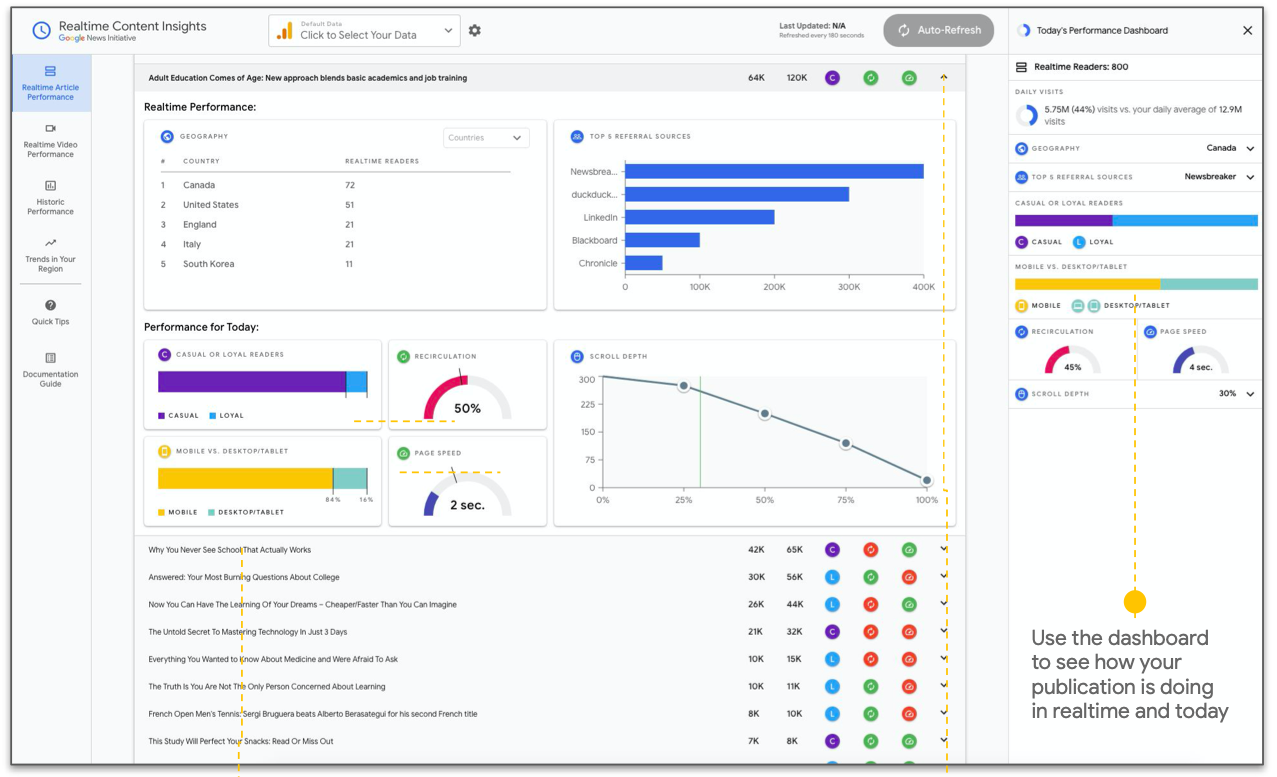
Source: A quick overview showing real-time readers with labels for C & L.
The article performance dashboard uses your Google Analytics data to display the currently trending and historically successful pieces of content.
Such data helps you understand your audience, choose where to position articles, identify important trends, and enhance the user experience.
Your videos are sorted based on their popularity among viewers at a given moment (when you are viewing a performance dashboard). You can also examine the percentage of new users against returning users. The data is displayed based on metrics like the percentage of videos watched until the end, muted/unmuted, fullscreen/cinema mode, etc.
Based on current statistics, it also reveals the following stats for the video —
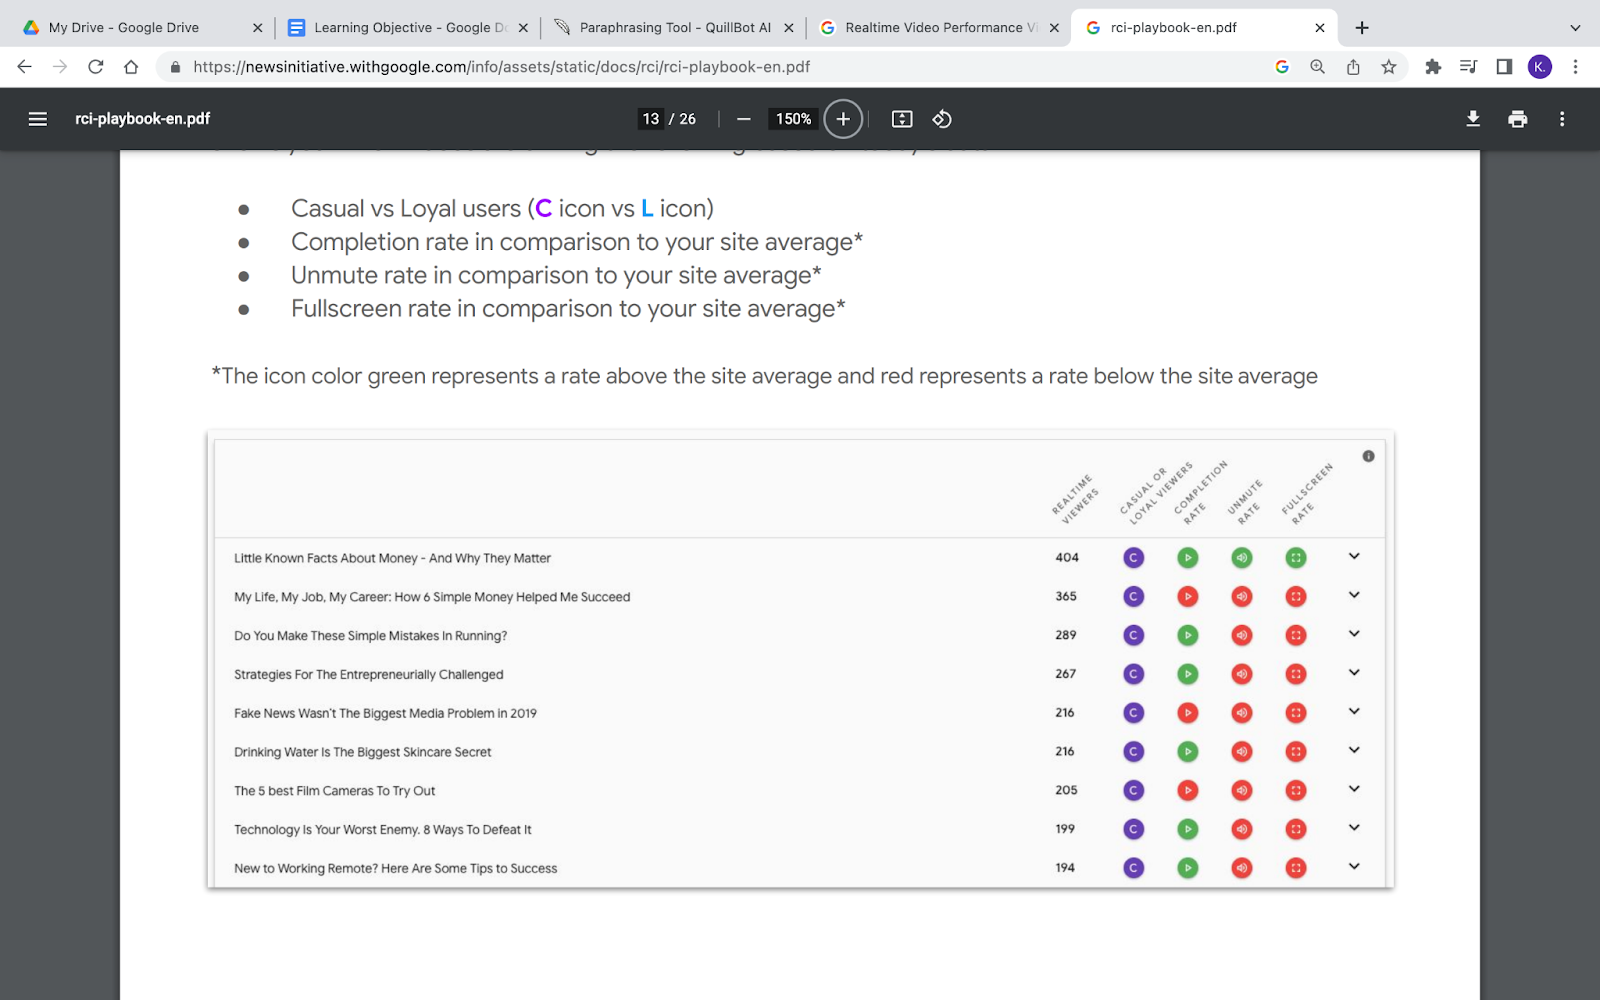
Screengrab: Showing the real time video analysis based on their titles.
This image shows real time viewers, where ‘C’ symbolizes casual viewers and other attributes.
The dashboard will offer real time data from Google Analytics to display the day’s most popular videos based on average metrics. Such data helps you understand your audience, spot trends better, and provide a more engaging video experience.
This report provides an in-depth study of your content’s performance compared to the site average provided by the Content Engagement Rank (CER). This goes beyond page views/views and spans all important engagement metrics like recirculation and percentage of loyal readers.
CER finds the most interesting or useful content based on users’ engagement. Also, you can identify articles that generate the most interest and lead to the most newsletter subscriptions. Overall, the CER score considers seven indicators for articles and four metrics for videos based on data from Google Analytics.
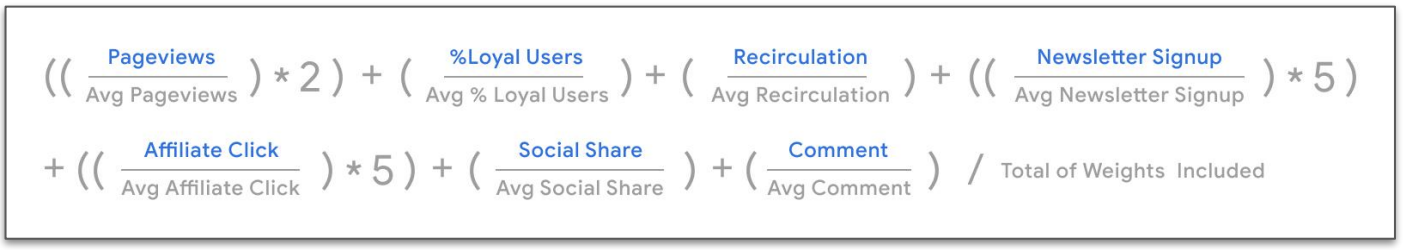
Screengrab: Formula to calculate CER along with metrics it considers
Use historical performance data to determine which content had the most influence on your readers. Improve your CER by leveraging News Tagging Guide’s Reader Engagement and Reader Revenue features.
In turn, this help identifies content (video and text) that interests your audience. It analyzes the effect of your key indicators compared to your average and rates your top 100 articles based on the level of interaction they received.
Google continuously updates a feature called Real Time Search Trends that includes articles widely shared and discussed on Google’s various platforms during the last 24 hours.
Leverage Google’s algorithm that compiles stories from several sources, including the Knowledge Graph, user queries, YouTube trends, and Google News articles. You can navigate the dropdown menu to see the interest in featured trending topics and related queries.
Pull the data from Google Trends to know what users search for (including on YouTube). Use the insight to ensure that your content fits into the larger news landscape at any given time. It can also give you ideas for potential stories that resonate with your readership and drive engagement.
Google News Initiative has developed the Real Time Content Insights add-on with the Use All Five. You can download it from the Google Chrome store to analyze how many users interact with your content in real time and in what manner (clicks, likes, comments, etc.).
Follow the below-mentioned steps to start using this extension.
Visit the Google Chrome store, search for “Real Time Content Insights Chrome Extension, and click on Add to Chrome
Before installing — Ensure that you are logged into the Google Account associated with your website’s Google Analytics account for which you want to track data.
Click “.Google sign-in” for access authorization.
Your data will load instantly, but before digging into it, make sure the appropriate “Google Analytics View” is chosen by clicking on the extension button.
If your account does not appear here or is incorrect, go to the website’s Google Analytics account, navigate to Admin > Property settings, and verify that the “Default URL” column is the same as your main URL/primary domain.
Some of its key features include the following—
Your current page’s real time article’s readership.
If you are running a news website or publishing content regularly, it is high time you start using Google’s Real Time Content Insights. Use it to enhance your readership based on data and increase video viewership based on the tool’s insights. Know what users are interested in at any moment and create an agile plan for content development that can widen your reach.
For starters, you can link your Google Analytics profile to RCI and see which articles and videos rank. Accordingly, you can create a content plan that better suits your loyal users to increase content consumption and acquire a larger market share in the longer run.